
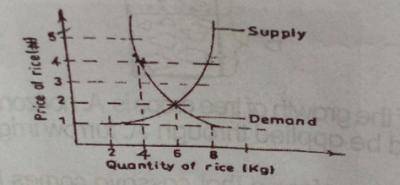
Study the graph illustrated above and answer this question correctly
The graph best_____________
- shows an increase in the supply of rice
- describes a shift in the demand for rice
-
describes the equilibrium price for rice

- shows that the demand for rice exceeds supply