
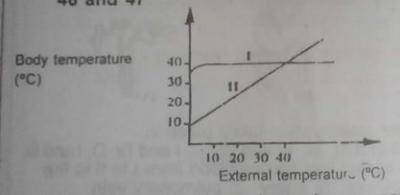
Use the diagram above to answer this question. From the graph above, it can be appropriately deduced that?
- the body temperature in ll varies with that in l
-
the body temperature in l is independent of external temperature

- l and ll maintain constant body temperature
- external temperatures affect the body temperature of l and ll
The correct answer is: B
Explanation
The body temperature in I is independent of external temperature.
There is an explanation video available .