
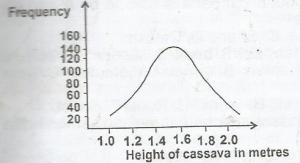
Use the diagram above to answer this question.
The graph illustrates
- the highest frequency for height of 2 metres
- a discontinuously varying character
-
a continuously varying character

- total yield in a cassava farm
The correct answer is: C
Explanation
No official explanation is available for this question at this time. Please check contributions posted by others below. If you can provide an explanation to help other student learn, pleaseThere is an explanation video available .