
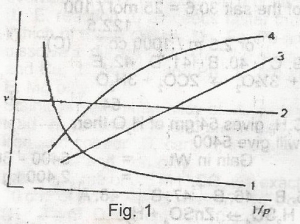
Which of the curves shown in the figure given represents the relationships between the volume(V) and pressure(P) of an ideal gas at constant temperature
- 1
- 2
-
3

- 4
- 1 and 3