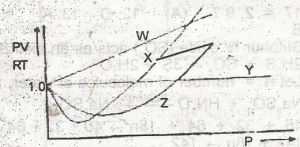
Which of the curves in the above graph illustrates the behaviour of an ideal gas?
W
X
Y
Z
The correct answer is: C
Explanation
No official explanation is available for this question at this time. Please check contributions posted by others below. If you can provide an explanation to help other student learn.