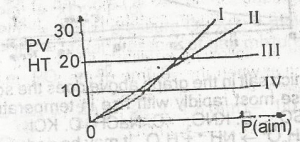
Which of the curves above represents the behaviour of 1 mole of an ideal gas?
l
ll
lll
lV
The correct answer is: C
Explanation
No official explanation is available for this question at this time. Please check contributions posted by others below. If you can provide an explanation to help other student learn.