
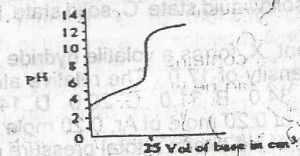
The option above shows the PH changes for the titration of a
- strong acid versus strong base
-
weak acid versus strong base

- strong acid versus weak base
- weak acid versus weak base
The correct answer is: B
Explanation
Option B is a graph of weak a acid and strong base