
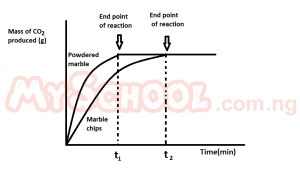
The graph above demonstrate the effect of?
-
surface area on the rate of reaction

- catalyst on the rate of reaction
- pressure on the rate reaction
- concentration on the rate of reaction
The correct answer is: A
Explanation
No official explanation is available for this question at this time. Please check contributions posted by others below. If you can provide an explanation to help other student learn, pleaseThere is an explanation video available .