
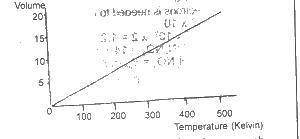
Which of the gas laws does this graph illustrate?
- Boyle
-
Charles

- Gay-Lussac
- Graham
The correct answer is: B
Explanation
Charles' law describes the effect of temperature changes on the volume of a given mass of gas at a constant pressure.
There is an explanation video available .