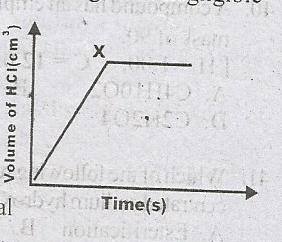
The following diagram illustrates the rate curve that was obtained when Mg reacted with excess dilute HCl.
The diagram became horizontal at X because

The following diagram illustrates the rate curve that was obtained when Mg reacted with excess dilute HCl.
The diagram became horizontal at X because
