
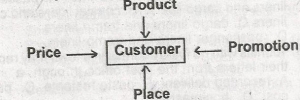
The chart above represent the?
- product mix relationship
-
marketing mix relationship

- promotion mix elationship
- advertising mix relationship