
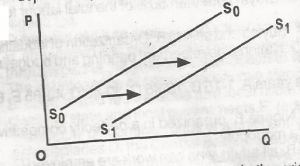
In the diagram, the supply curve So So shifts to a new position S1 S1 to indicate
- a drop in supply
-
a rise in supply

- a supply- push inflation
- a stable supply curve
- an increase in quantity supplied