
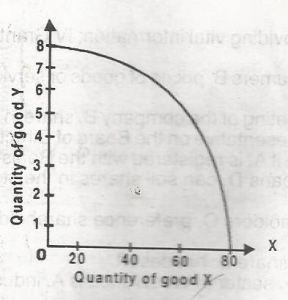
The above diagram showing the maximum possible combination of commodities X and Y produced in Nigeria is called the
- Production indicator
- Maximum production curve
-
Production possibility curve

- Total output curve