
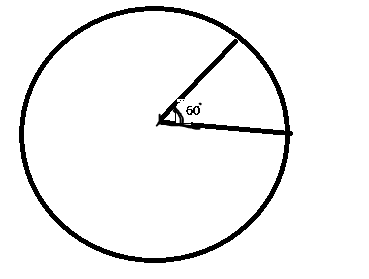
The pie chart above represents the total population of a school of 1,200. The shaded area of 60º shows the population of the underaged pupils.
What is the population of the matured students?
- 600
- 800
-
1000

- 1200
The correct answer is: C
Explanation
Population of underaged student = \(\frac{60}{360}\) x 1200
= 200
Population of matured student = 1200 - 200 = 1000.