
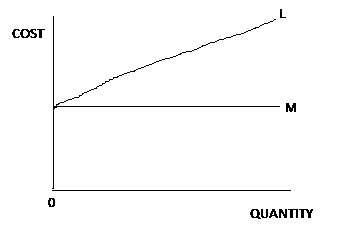
The line labelled M in the diagram above represent
- total cost
-
fixed cost

- variable cost
- average cost
The correct answer is: B
Explanation
The curve labelled M represent fixed cost. The fixed do not vary with the level of output.