
The diagram above represent
- structural unemployment
-
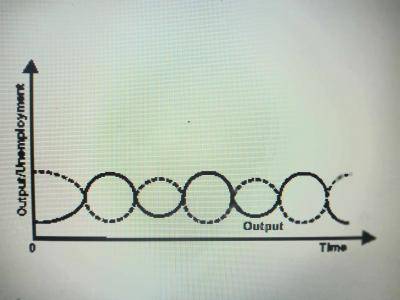
cyclical unemployment

- volunatary unempployment
- frictional unemployment
The correct answer is: B
Explanation
The dotted line in the graph above represent the upturn and downturn of the econonmy. Therefore, the diagram is cyclical unemployment.