
The diagram belwo, shows the relationship between
- minimum wage and unemployment
- equilibrium wage rate and philip curve
- W4 and W3
-
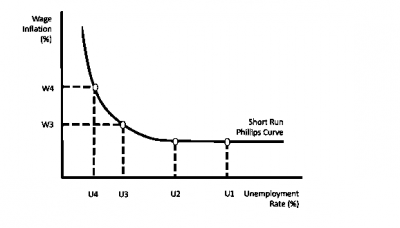
wage rate and unemployment

The correct answer is: D
Explanation
The Phillip curve is an economic concept that shows the inverse relationship between inflation and unemployment in the short run. It suggests that when unemployment is low, inflation tends to be high, and vice versa. The Phillip curve ca be used to understand the relationship between wage rate and unemployment in terms of inflationary pressures.