
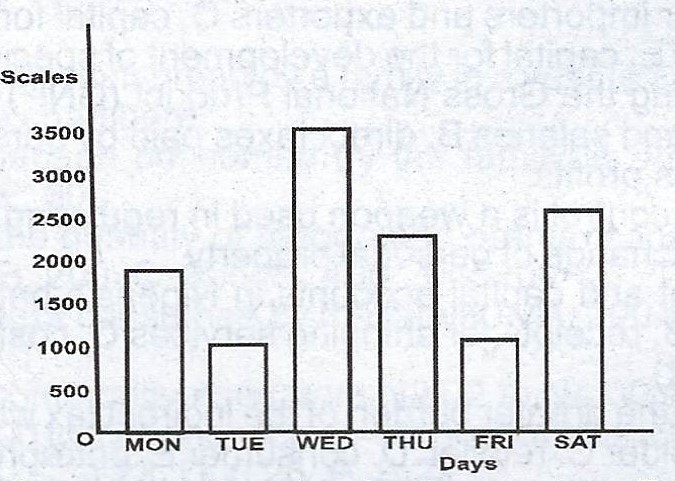
The daily sales of a department store for one week are as follows
| Days | Mon | Tue. | Wed. | Thu. | Fri. | Sat. |
| Sales N | 1750 | 1000 | 3500 | 2250 | 1000 | 2500 |
(a) Present the above data in a bar graph. (The use of graph sheet is essential).
(b) Calculate the average utility curve.
Explanation
(b) Average daily sales for the week =
Total sales
No. of days
\(\frac{N1,750 + 1,000 + 3,500 + 2,250 + 1,000 + 2,500} {6}\)
\(\frac{12000}{6}\) = N2,000