The output and cost of production of rice (in bags) are presented in the table below. Use the information in the table to answer the questions that follow.
| Output of rice (in bags) | 0 | 1 | 2 | 3 | 4 |
| Total Variables Coat (TVC) $ | 0 | 5 | 7 | 10 | 20 |
| Total Cost (TC) $ | 7 | 12 | 14 | 17 | 27 |
(a) Calculate the
(i) Average Fixed Cost (AFC) at output levels 0,2 and 4
(ii) Marginal Cost (MC) at all levels of output
(b) If the price of a bag of rice were $10,
(i) calculate the profit/loss at all levels of output.
(ii) at what output level(s) is the maximum profit made?
(c) Draw the marginal cost curve (the use of graph sheet is essential).
Explanation
(a)(i) When output is 0, AFC = 7/0 = 00; When output is 2, AFC = 7/2 = $3.5; When output is 4, AFC = 7/4 = $1.75
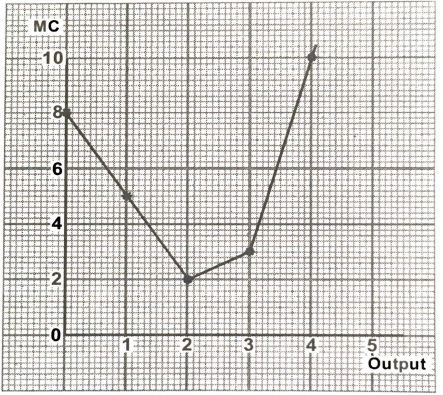
(ii) At output 0, marginal cost (MC) = 7 - 0 = $7; At output 1, marginal cost (MC) = 12-7 = $5; At output 2, marginal cost (MC) =14 -12 = $2; At output 3, marginal cost (MC) = 17-14 = $3; At output 4, marginal cost (MC) = 27-17 = $10.
(b) If price were to be $10 per bag,
(i) When output is 0, profit = (TR - TC), TR = $10 x 0 = 0, TC = $7, profit = 0 - 7 = $7.00 loss or - $7.00. When output is 1, TR = $10 x 1 = $10 , TC = $12, profit $10 - 12 = $2 .00 loss or - $2.0. When output is 2, TR = $10 x 2 = $20 , TC = $14, profit = $20 - $14 = $6 .00 profit. When output is 3, TR = $10 x 3 = $30 , TC = $17, profit = $30 - 17 = $13.00. When output is 4, TR = $10 x 4 = $40 , TC = $27, profit = $40 - $27 = $13.00.
(ii) Maximum profit is made when output is 3 bags and 4 bags.
(c) Draw the Marginal cost curve (the use of graph sheet is essential)