
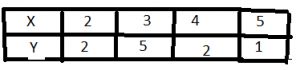
Use this above diagram to answer this question. From the table, the mean of the distribution is
- 2.2
- 2.5
-
3

- 4.5
The correct answer is: C
Explanation
mean refers to the mean or average that is used to derive the central tendency of the data in question. It is determined by adding all the data points in a population and then dividing the total by the number of points. The resulting number is known as the mean or the average.Thus we have;
1+2+2+2+3+4+5+5 = 24 ÷ 8 = 3