
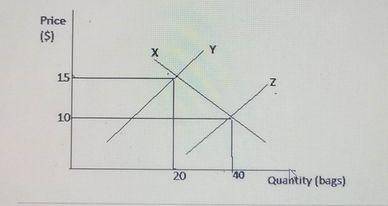
(ai) The diagram above shows the effects of the introduction of a subsidy on the production of maize. Study the diagram and answer the questions that follow.
Identify the curves labelled X,Y,Z
(aii) The diagram below shows the effects of the introduction of a subsidy on the production of maize. Study the diagram and answer the questions that follow.

State the direction of change in price and quantity with the introduction of subsidy
(bi) The diagram below shows the effects of the introduction of a subsidy on the production of maize. Study the diagram and answer the questions that follow.
Calculate the total revenue of the producers before the introduction of subsidy
(bii) The diagram below shows the effects of the introduction of a subsidy on the production of maize. Study the diagram and answer the questions that follow.
Calculate the total revenue of the producers after the introduction of subsidy
(c) The diagram below shows the effects of the introduction of a subsidy on the production of maize. Study the diagram and answer the questions that follow.
Calculate the percentage increase or decrease in total revenue of the producers with the introduction of subsidy
(d) The diagram below shows the effects of the introduction of a subsidy on the production of maize. Study the diagram and answer the questions that follow.
If the quantity demanded of maize increases from 20 to 40 bags as a result of a fall in price from $15 to $10, calculate the price elasticity of demand.
(e) The diagram below shows the effects of the introduction of a subsidy on the production of maize. Study the diagram and answer the questions that follow.
State the type of elasticity of demand in 2(d).
Explanation
(ai) - The curve X represents the demand curve
- The curve Y represents the old supply curve
- The curve Z represents the new supply curve
(aii) Subsidy will shift the supply curve to the right causing price to fall and the quantity demanded to increase
(bi) Total revenue = Price x Quantity
Before subsidy, TR = 20 x 15
= $300
(bii) After subsidy, TR = 10 x 40
= $400
(c) % increase in revenue = 400 - 300/300 x 100
= 33.33%
(d) e = ∆Qd/∆P x P/Qd
e = 40 - 20/10 - 15 x 15/20
e = 20/-5 x 15/20
e = - 3 since elasticity is always positive. Therefore, e = 3
(e) It is an elastic demand because an increase in quantity demanded leads to a fall in the price of maize.