
(a) Using a scale of 2 cm to 30° on the x- axis, 2 cm to 0.2 units on the y- axis, on the same graph sheet, draw the graphs of \(y = \sin 2x\) and \(y = \cos x\) for \(0° \leq x \leq 210°\) at intervals of 30°.
(b) Using the graphs in (a), find the truth set of :
(i) \(\sin 2x = 0\) ; (ii) \(\sin 2x – \cos x = 0\).
Explanation
(a) Table of values for \(y = \sin 2x\) and \(y = \cos x\).
| x | 0° | 30° | 60° | 90° | 120° | 150° | 180° | 210° |
| \(y = \sin 2x\) | 0 | 0.87 | 0.87 | 0 | -0.87 | -0.87 | 0 | 0.87 |
| \(y = \cos x\) | 1 | 0.87 | 0.50 | 0 | -0.50 | -0.87 | -1 | -0.87 |
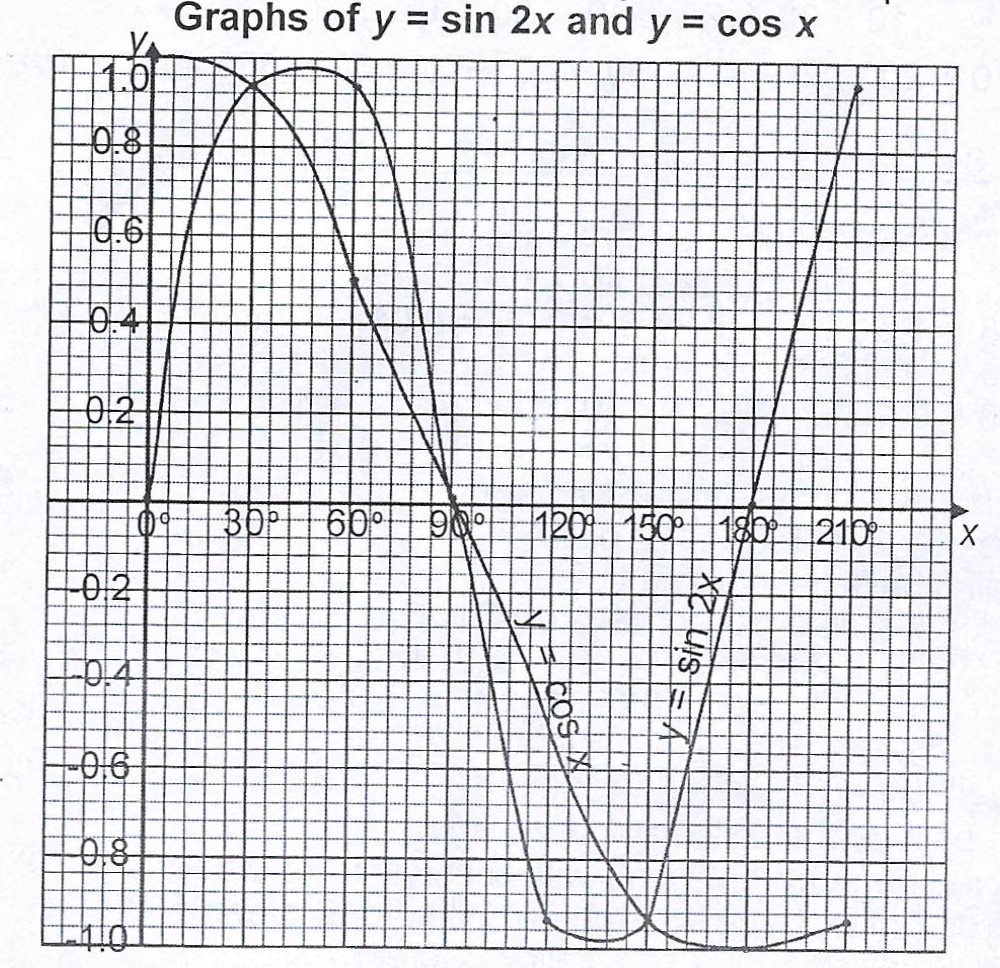
(b)(i) \(\sin 2x = 0 \implies x = 0°, 90°, 180°\)
(ii) \(\sin 2x - \cos x = 0 \implies x = 30°, 90°, 150°\).