
The table gives the relationship between the height, in metres, of a plant and the number of days it is left to grow.
|
Number of days (x) |
10 | 20 | 30 | 40 | 50 | 60 | 70 | 80 |
| Height (y) | 1.0 | 1.1 | 1.2 | 1.4 | 1.6 | 1.8 | 2.0 | 2.3 |
(a) Using a scale of 2 cm to represent 0.5 units on the y- axis and 2cm to 10 units on the x- axis, draw a scatter diagram for the information.
(b) Find \(\bar{x}\), the mean of x, and \(\bar{y}\), the mean of y, and plot \((\bar{x}, \bar{y})\) on the diagram.
(c) Draw the line of best fit to pass through \((\bar{x}, \bar{y})\) and \((10, 1)\).
(d) From graph, find the :
(i) equation of the line of best fit ; (ii) height of plant in 75 days.
Explanation
(a & c) 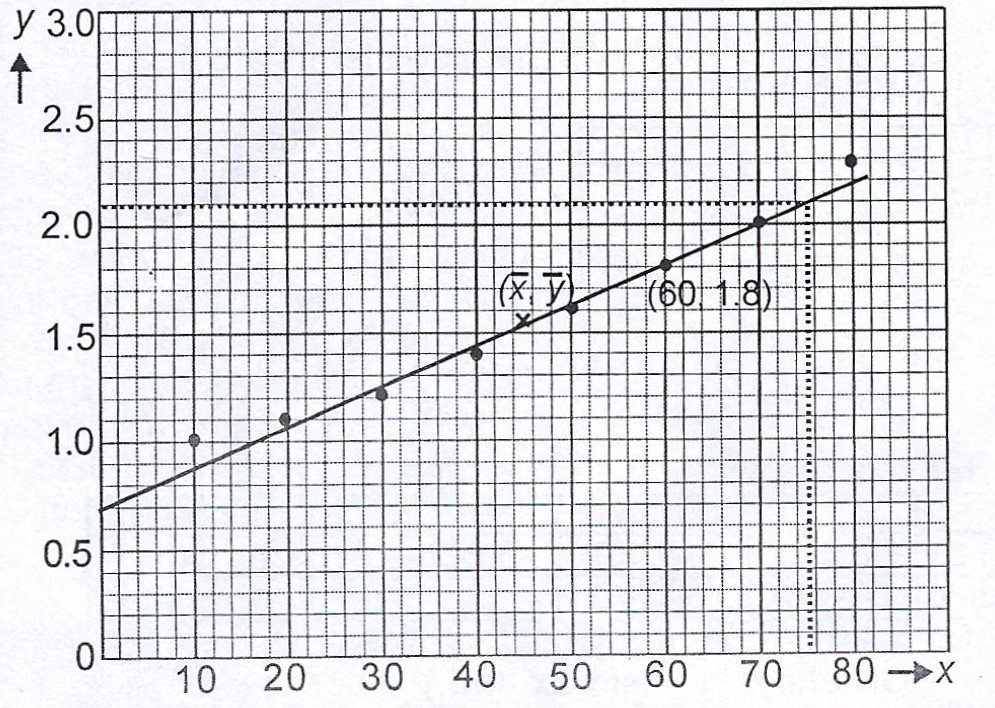
(b) \(\bar{x} = \frac{10 + 20 + 30 + 40 + 50 + 60 + 70 + 80}{8} = \frac{360}{8} = 45\)
\(\bar{y} = \frac{1.0 + 1.1 +1.2 + 1.4 + 1.6 + 1.8 + 2.0 + 2.3}{8} = \frac{12.4}{8} = 1.55\)
\(\therefore (\bar{x}, \bar{y}) = 45, 1.55\).
(d)(i) Equation of line of best fit :
\(\frac{y - 1.8}{x - 60} = \frac{1.8 - 1.55}{60 - 45}\)
\(\frac{y - 1.8}{x - 60} = \frac{0.25}{15} = 0.017\)
\(y - 1.8 = 0.017(x - 60) \implies y - 1.8 = 0.017x - 1.02\)
\(y = 0.017x - 1.02 + 1.8 = 0.017x + 0.78\)
(ii) When x = 75 days, \(y = 0.017(75) + 0.78\)
= \(2.055\)