
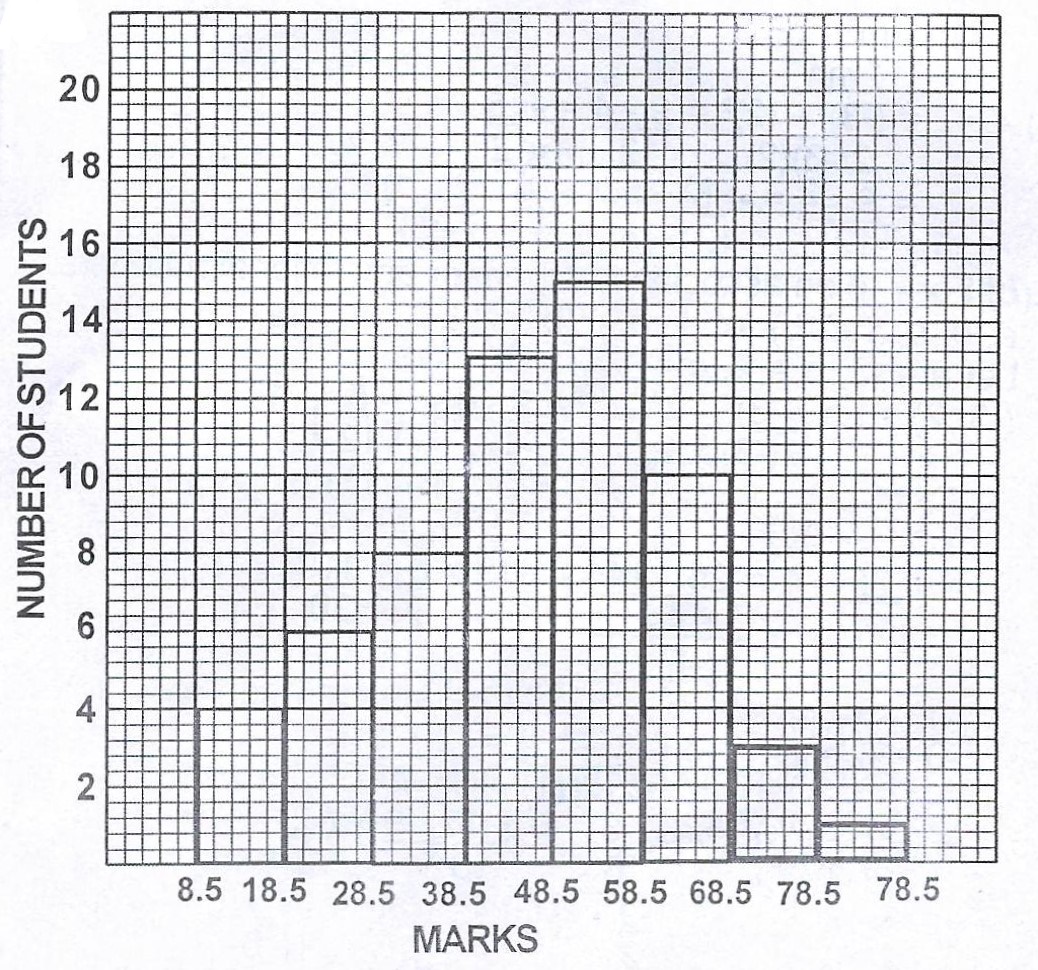
The histogram above represents the scores of some candidates in an examination.
(a) Using the histogram, construct a frequency distribution table indicating clearly the class intervals ;
(b) Draw a cumulative frequency curve of the distribution and use it to estimate the :
(i) median ; (ii) quartile deviation.
Explanation
(a)
| Score | Freq |
| 9 - 18 | 4 |
| 19 - 28 | 6 |
| 29 - 38 | 8 |
| 39 - 48 | 13 |
| 49 - 58 | 15 |
| 59 - 68 | 10 |
| 69 - 78 | 3 |
| 79 - 88 | 1 |
(b)
|
Upper class boundary |
Freq. | Cum. Freq |
| 18.5 | 4 | 4 |
| 28.5 | 6 | 10 |
| 38.5 | 8 | 18 |
| 48.5 | 13 | 31 |
| 58.5 | 15 | 46 |
| 68.5 | 10 | 56 |
| 78.5 | 3 | 59 |
| 88.5 | 1 | 60 |
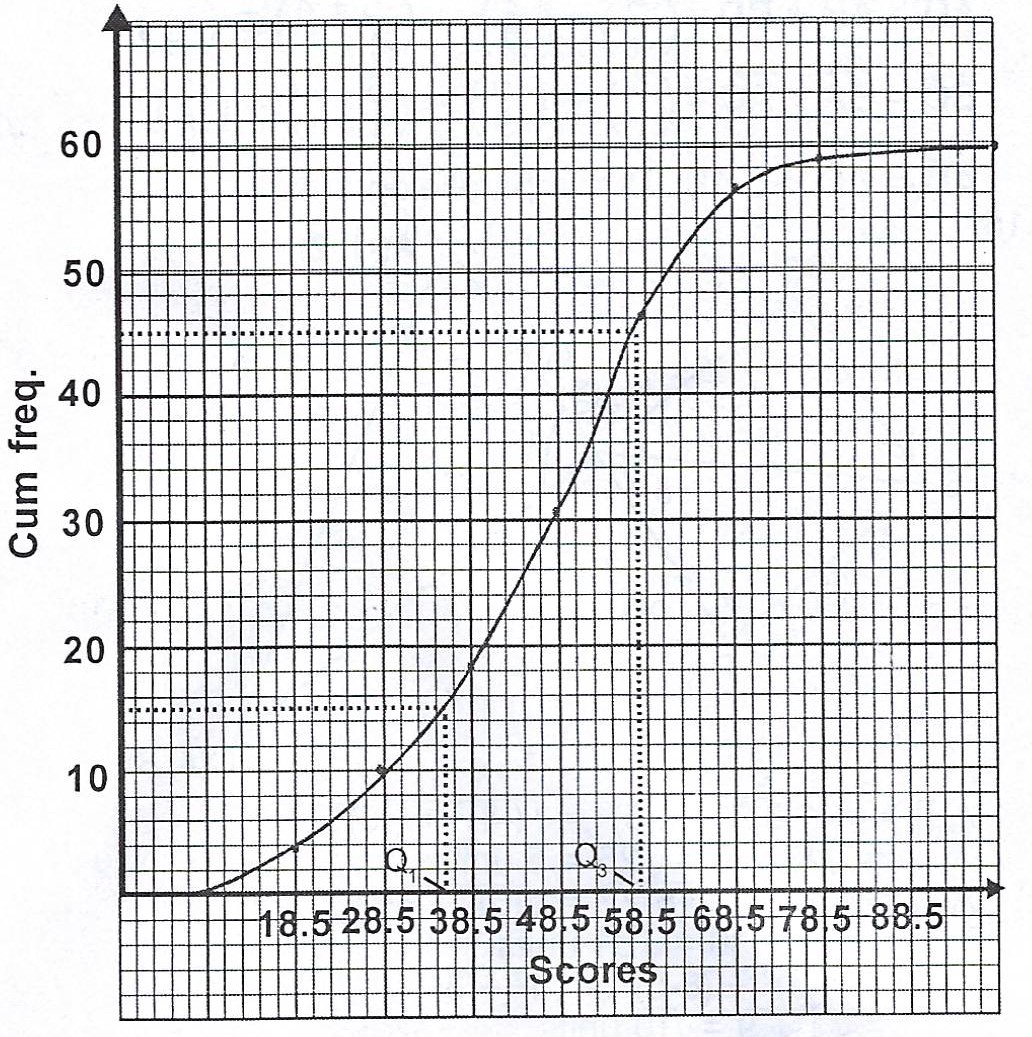
(i) Median, \(Q_{2} = \frac{1}{2} \text{Nth score}\)
= \(\frac{1}{2} \text{60th score} = 30th\) score.
= \(48.4\)
(ii) \(Q_{1} = 35.5 ; Q_{3} = 57.5\)
Quartile deviation = \(\frac{1}{2} (Q_{3} - Q_{1})\)
= \(\frac{1}{2} (57.5 - 35.5) = \frac{1}{2} (22)\)
= \(11.0\)