
The table shows the distribution of the heights of a group of people.
|
Height (m) |
0.4 – 0.5 | 0.6 – 0.9 | 1.0 – 1.2 | 1.3 – 1.4 | 1.5 – 1.7 |
| Number of people | 2 | 8 | 12 | 6 | 6 |
(a) Draw a histogram to illustrate the distribution.
(b) Using an assumed mean of 1.1m, find, correct to one decimal place, the mean height of the group.
Explanation
| Height (m) | frequency | boundaries | freq. density |
| 0.4 - 0.5 | 2 | 0.35 - 0.55 | 10 |
| 0.6 - 0.9 | 8 | 0.55 - 0.95 | 20 |
| 1.0 - 1.2 | 12 | 0.95 - 1.25 | 40 |
| 1.3 - 1.4 | 6 | 1.25 - 1.45 | 30 |
| 1.5 - 1.7 | 6 | 1.45 - 1.75 | 20 |
(a) 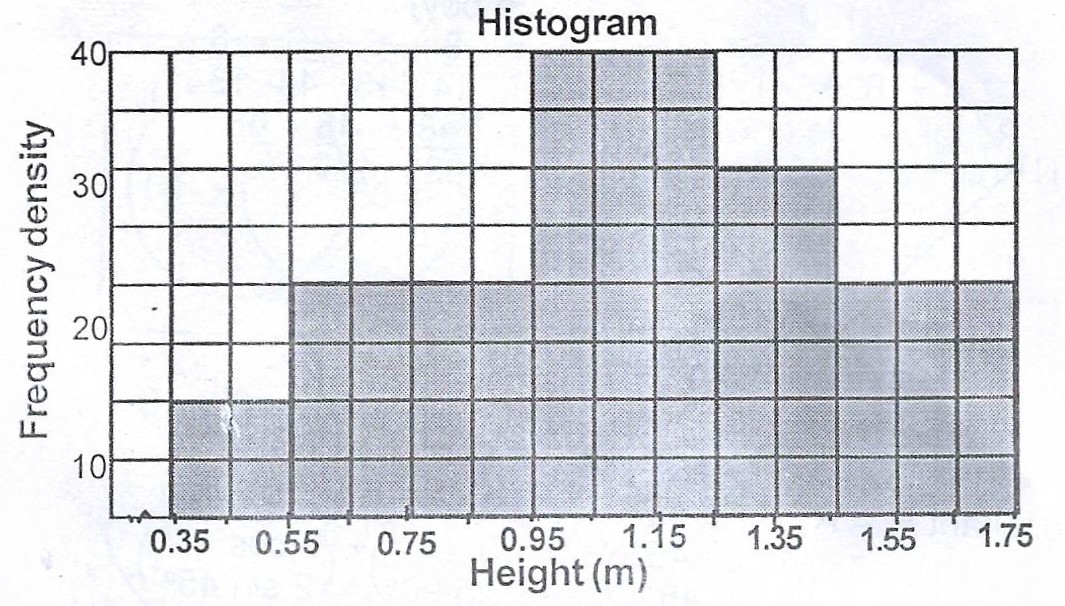
(b) Assumed mean = 1.1m
| Height (m) |
mid-height x |
Frequency | \(d = x - A\) |
\(fd\)
|
| 0.4 - 0.5 | 0.45 | 2 | -0.65 | -1.3 |
| 0.6 - 0.9 | 0.75 | 8 | -0.35 | -2.8 |
| 1.0 - 1.2 | 1.10 | 12 | 0 | 0 |
| 1.3 - 1.4 | 1.35 | 6 | 0.25 | 1.5 |
| 1.5 - 1.7 | 1.60 | 6 | 0.5 | 3.0 |
| 34 | 0.4 |
\(Mean = A + \frac{\sum fd}{N}\)
= \(1.1 + \frac{0.4}{34}\)
= \(1.1 + 0.0118\)
= \(1.1118\)
\(\approxeq 1.1\) (to 1 d.p)