
The table shows the distribution of marks scored by some students in a test.
| Marks | 1-10 | 11-20 | 21-30 | 31-40 | 41-50 | 51-60 | 61-70 | 71-80 | 81-90 | 91-100 |
| No. of students | 3 | 17 | 41 | 85 | 97 | 115 | 101 | 64 | 21 | 6 |
(a)(i) Construct a cumulative frequency table for the distribution ; (ii) Draw a cumulative frequency curve for the distribution.
(b) Use the curve to estimate the :
(i) number of students who scored marks between 32 and 74 ; (ii) pass mark, if 18% of the students failed ; (iii) lowest mark for distinction, if 8% of the students passed with distinction.
Explanation
(a)(i)
|
Marks (x) |
Limits | Frequency |
Cum freq (\(\sum f\)) |
| 1 - 10 | 0.5 - 10.5 | 3 | 3 |
| 11 - 20 | 10.5 - 20.5 | 17 | 20 |
| 21 - 30 | 20.5 - 30.5 | 41 | 61 |
| 31 - 40 | 30.5 - 40.5 | 85 | 146 |
| 41 - 50 | 40.5 - 50,5 | 97 | 243 |
| 51 - 60 | 50.5 - 60.5 | 115 | 358 |
| 61 - 70 | 60.5 - 70.5 | 101 | 459 |
| 71 - 80 | 70.5 - 80.5 | 64 | 523 |
| 81 - 90 | 80.5 - 90.5 | 21 | 544 |
| 91 - 100 | 90.5 - 100.5 | 6 | 550 |
(ii) 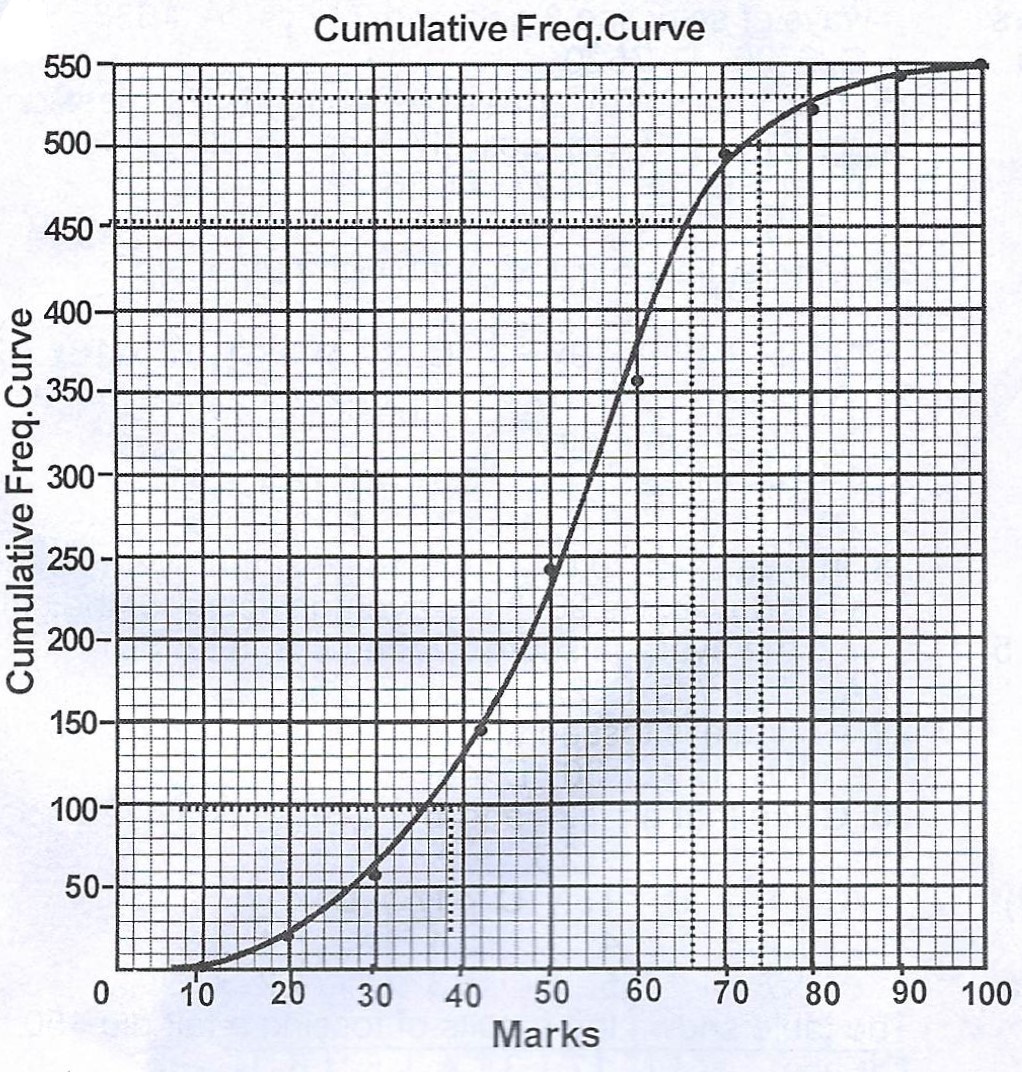
(b)(i) Those who scored less and equal to 32 marks = 75
Those who scored greater and equal to 74 = 508
Therefore those that scored between 32 and 74 = 508 - 75 = 433.
(ii) 18% of 550 = 99
18% failed, the number that passed = 550 - 99 = 451.
(iii) 8% passed with distinction, so 92% did not get distinction.
92% of 550 = 506.
Lowest mark for distinction = 74.