
The table shows the frequency distribution of the ages of patients in a clinic.
| Ages (years) | 17 – 19 | 20 – 22 | 23 – 28 | 29 – 34 | 35 – 43 |
| No. of patients | 6 | 9 | 12 | 18 | 18 |
(a) Draw a histogram for the distribution
(b) Find, correct to two decimal places, the mean age of the patients.
Explanation
| Age (yr) | Frequency | Class boundary | Class width | Height |
| 17 - 19 | 6 | 16.5 - 19.5 | 3 | 2 |
| 20 - 22 | 9 | 19.5 - 22.5 | 3 | 3 |
| 23 - 28 | 12 | 22.5 - 28.5 | 6 | 2 |
| 29 - 34 | 18 | 28.5 - 34.5 | 6 | 3 |
| 35 - 43 | 18 | 34.5 - 43.5 | 9 | 2 |
(a) 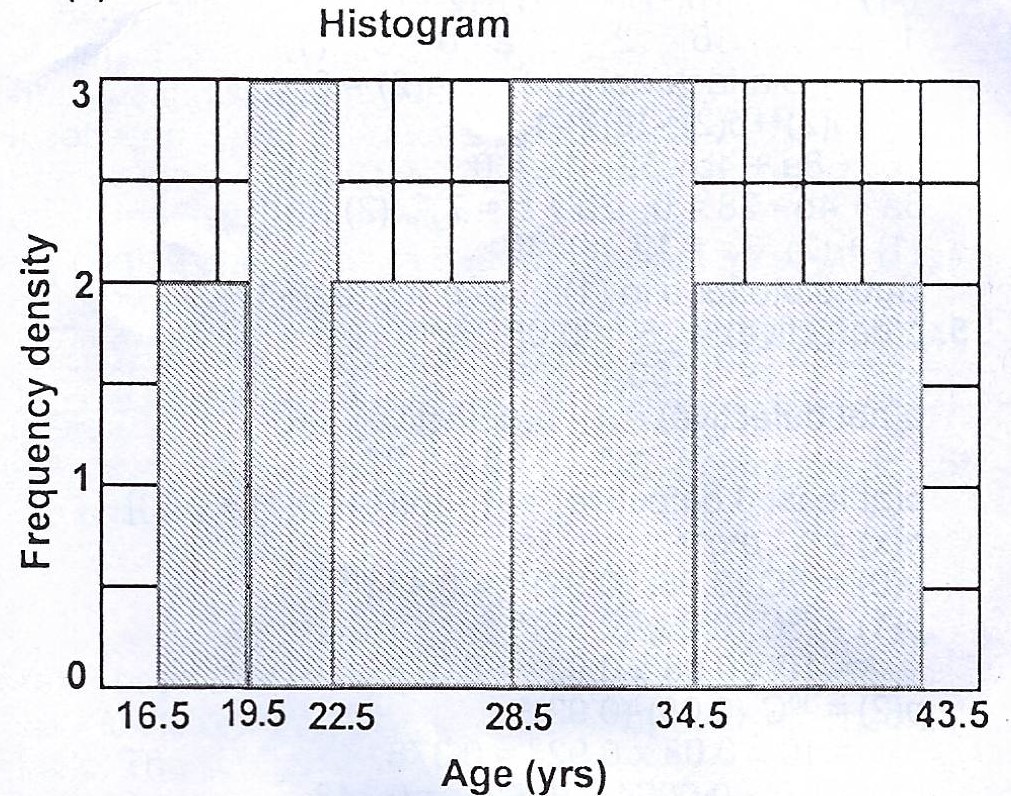
(b) Let the assumed mean be 25.5 yrs.
| Age (yr) | Mid-age (x) | Freq (f) | \(d = x - A\) | \(fd\) |
| 17 - 19 | 18 | 6 | -7.5 | -45 |
| 20 - 22 | 21 | 9 | -4.5 | -40.5 |
| 23 - 28 | 25.5 | 12 | 0 | 0 |
| 29 - 34 | 31.5 | 18 | 6.0 | 108 |
| 35 - 43 | 39.0 | 18 | 13.5 | 243 |
| 63 | 265.5 |
Mean = \(A + \frac{\sum fd}{\sum f}\)
= \(25.5 + \frac{265.5}{63}\)
= \(25.5 + 4.21\)
= \(29.71 yrs\)