
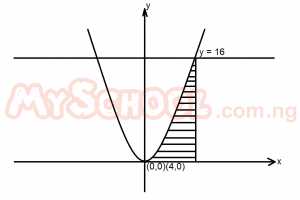
The diagram above is the graph of y = x2, the shaded area is
- 64 square units
- 128/3 square units
-
64/3 square units

- 32 square units
The correct answer is: C
Explanation
\(\int_0 ^4 x^2 dx = \left[\frac{1}{3}x^2+C\right]_0 ^4\\=\frac{1}{3}\times 4^3 - \frac{1}{3}\times 0^3\\
=\frac{64}{3}-0\\
=\frac{64}{3}\)sq units