
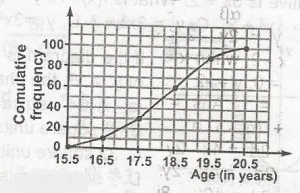
The cumulative frequency curve represents the ages of ages of students in a school. What age group do 70% of the students belongs?
-
17.5 - 20.5

- 16.5 - 19.5
- 15.5 - 19.5
- 15.5 - 18.5
The correct answer is: A
Explanation
If the total number of students represents 100%, then 70% corresponds to the point on the graph where the cumulative frequency reaches 70
From the graph, find where the cumulative frequency line intersects the 70% mark. This typically corresponds to a specific age on the X-axis
There is an explanation video available .