
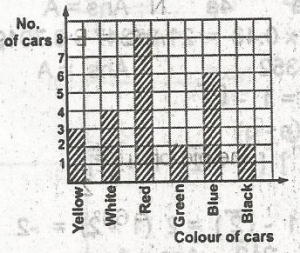
The bar chart shows different colours of cars passing a particular point of a certain street in two minutes. What fraction of the cars is yellow
- \(\frac{1}{5}\)
- \(\frac{2}{25}\)
- \(\frac{4}{15}\)
-
\(\frac{3}{25}\)

The correct answer is: D
Explanation
\(\begin{array}{c|c} \text{colour of cars} & \text{Number (frequency)} \\ \hline yellow & 3 \\white & 4\\ red & 8\\ green & 2\\ blue & 6\\ black & 2\\ \hline & 25 \\ \hline\end{array}\)Thus, the fraction of the total numbers that are yellow is \(\frac{3}{25}\)
There is an explanation video available .