
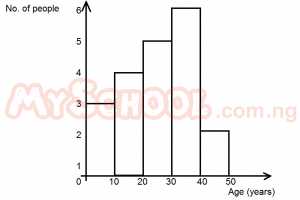
The histogram above shows the ages of the victims of a pollution. How many people were involved in the pollution?
- 15
- 18
-
20

- 21
The correct answer is: C
Explanation
| age | People |
| 10 | 3 |
| 20 | 4 |
| 30 | 5 |
| 40 | 6 |
| 50 | 2 |
| 20 |