
| Marks | 3 | 4 | 5 | 6 | 7 | 8 |
| Frequency | 5 | y – 1 | y | 9 | 4 | 1 |
The table above gives the frequency distribution of marks obtained by a group of students in a test. If the total mark scored is 200, calculate the value of y
- A. 15
- B. 13
- C. 11
- D. 8

What is the mean deviation of 3, 5, 8, 11, 12 and 21?
- A. 4.7
- B. 60
- C. 3.7
- D. 10
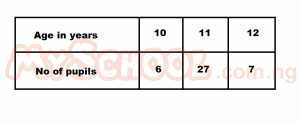
The table above shows the number of pupils in each age group in a class. What is the probability that a pupil chosen at random is at least 11 years old?
- A. 27/40
- B. 17/20
- C. 3/30
- D. 33/40
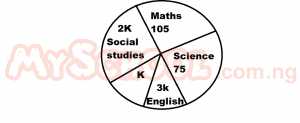
The pie chart above illustrate the amount of private time a student spends in a week studying various subjects. Find the value of k
- A. 90o
- B. 60o
- C. 30o
- D. 40o
A senatorial candidate had planned to visit seven cities prior to a primary election. However, he could only visit four of the cities. How many different itineraries could be considered?
- A. 640
- B. 840
- C. 520
- D. 920
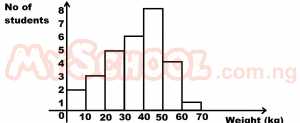
The histogram above represents the weights of students who traveled out to their school for an examination. How many people made the trip?
- A. 78
- B. 38
- C. 29
- D. 69
In a basket, there are 6 grapes, 11 bananas and 13 oranges. If one fruit is chosen at random. What is the probability that the fruit is either a grape or a banana
- A. 6/30
- B. 5/30
- C. 17/30
- D. 11/30
If 5, 8, 6 and 2 occur with frequencies 3, 2, 4 and 1 respectively. Find the product of the modal and the median number
- A. 36
- B. 48
- C. 30
- D. 40