
The graph above represents inequalities
- 3x +4y ≥12, x >0, y > 0
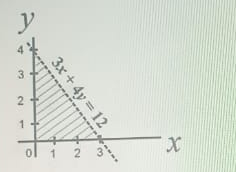
- 3x + 4y\(\leq\) 12, x ≥ 0, y ≥ 0
- 3x + 4y <12, x \(\leq\) 0, y ≥ 0
-
3x + 4y < 12, x ≥ 0, y ≥ 0

The correct answer is: D
Explanation
3x + 4y < 12, x ≥ 0, y ≥ 0 represent the graph above.
There is an explanation video available .