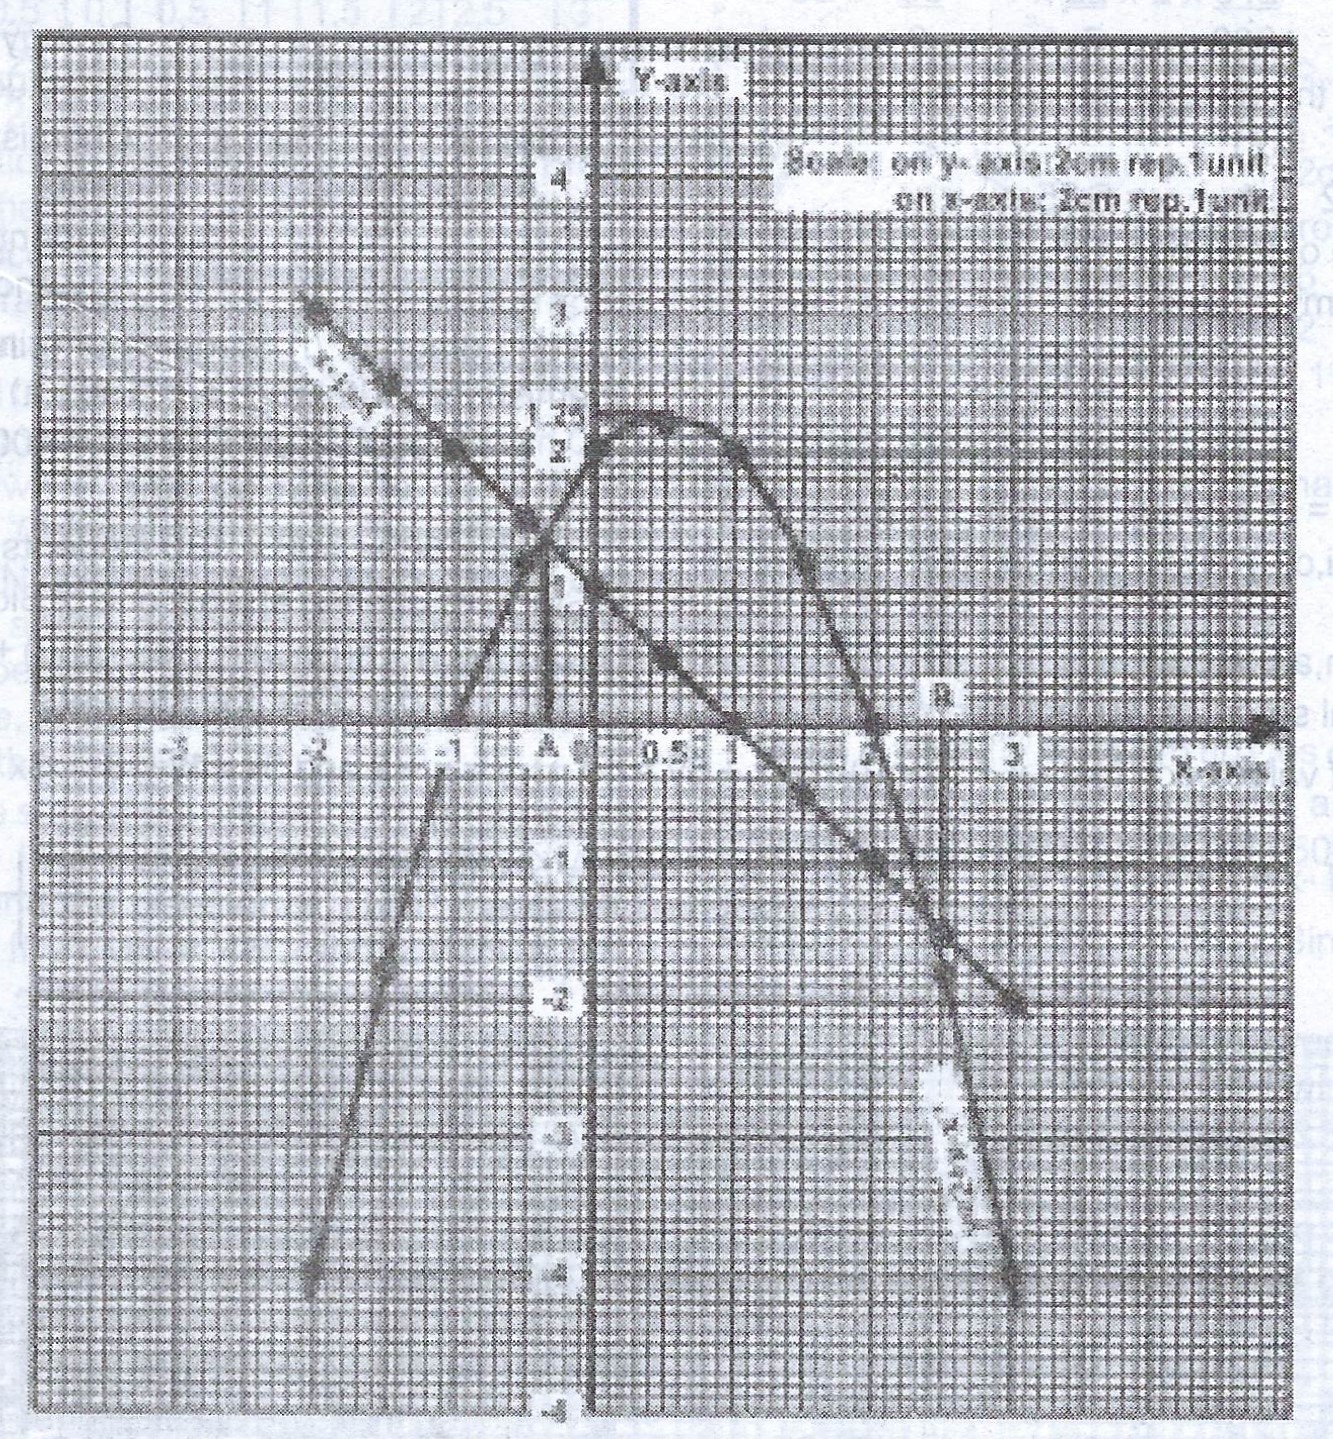
The table below is for the relation \(y = 2 + x – x^{2}\)
| x | -2 | -1.5 | -1 | -0.5 | 0 | 0.5 | 1 | 1.5 | 2 | 2.5 | 3 |
| y | -4 | -1.75 | 0 | 1.25 | 2 | 2.25 | 2 | 1.25 | 0 | -1.75 | -4 |
(a) Using a scale of 2cm to 1 unit on each axis, draw the graph of the relation in the interval \(-2 \leq x \leq 3\).
(b) From your graph, find the greatest value of y and the value of x for which this occurs.
(c) Using the same scale and axes, draw the graph of \(y = 1 – x\)
(d) Use your graphs to solve the equation \(1 + 2x – x^{2} = 0\)
Explanation
(a) 
(b) The greatest value of y = 2.25 and this occurs at x = 0.5.
(c) Table of values of \(y = 1 - x\)
| x | -2 | 2 |
| y | 3 | -1 |
(d) \(1 + 2x - x^{2} = 0\)
\(1 + 1 + 2x - x - x^{2} = 1 - x\)
\(2 + x - x^{2} = 1 - x\)
The solution of \(1 + 2x - x^{2} = 0\) occurs at the point of intersection of \(y = 2 + x - x^{2}\) and \(y = 1 - x\). This is at points A (x = -0.8) and B (x = 2.8).

