
The table below shows the frequency distribution of the marks of 800 candidates in an examination.
| Marks | 0-9 | 10-19 | 20-29 | 30-39 | 40-49 | 50-59 | 60-69 | 70-79 | 80-89 | 90-99 |
| Freq | 10 | 40 | 80 | 140 | 170 | 130 | 100 | 70 | 40 | 20 |
(a) (i) Construct a cumulative frequency table ; (ii) Draw the Ogive ; (iii) Use your ogive to determine the 50th percentile.
(b) The candidates that scored less than 25% are to be withdrawn from the institution, while those that scored than 75% are to be awarded scholarship. Estimate the number of students that will be retained, but will not enjoy the award.
Explanation
(a)(i)
| Marks (%) | Freq | Cum Freq |
| 0 - 9 | 10 | 10 |
| 10 - 19 | 40 | 50 |
| 20 - 29 | 80 | 130 |
| 30 - 39 | 140 | 270 |
| 40 - 49 | 170 | 440 |
| 50 - 59 | 130 | 570 |
| 60 - 69 | 100 | 670 |
| 70 - 79 | 70 | 740 |
| 80 - 89 | 40 | 780 |
| 90 - 99 | 20 | 800 |
(ii) 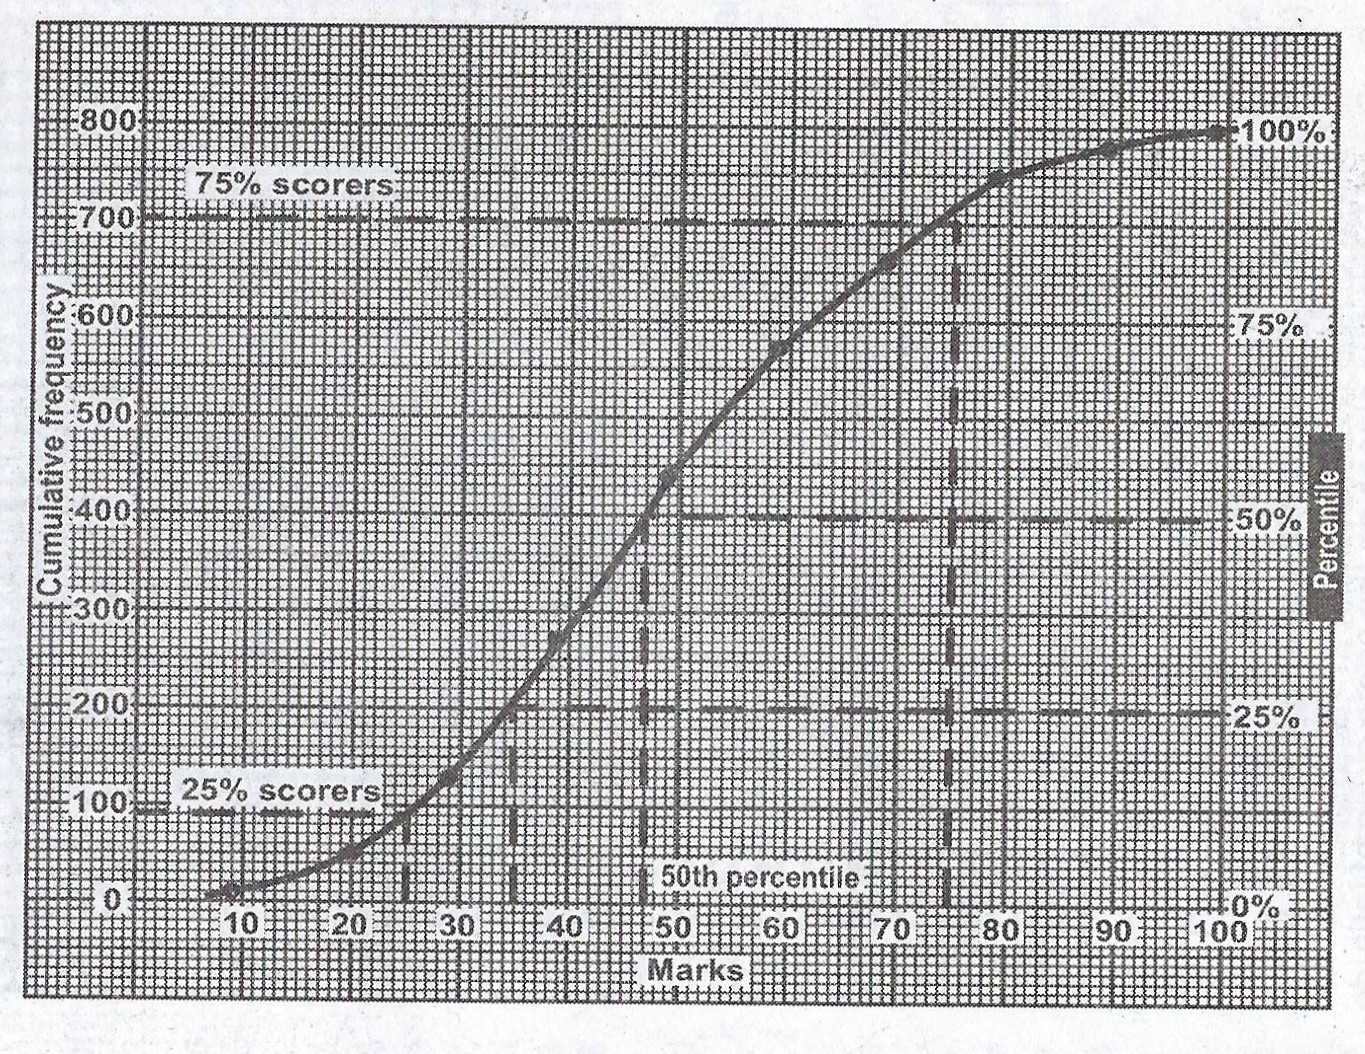
(iii) From the Ogive, the 50th percentile is 70 marks.
(b) Those who scored below 25% (24% and below) = 85 students
Those who scored 75% and below = 710
\(\therefore\) Those who scored above 75% = 800 - 710 = 90 students
Those to be retained without award = 800 - (85 + 90)
= 800 - 175 = 625 students.