
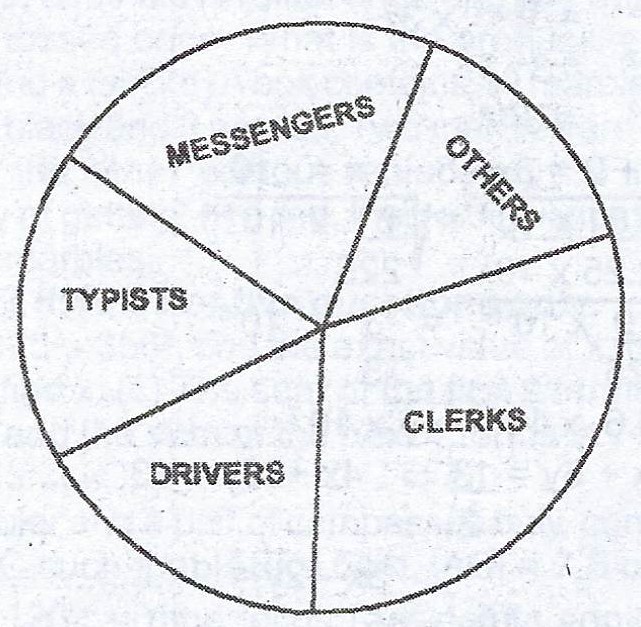
(a) The distribution of junior workers in an institution is as follows: Clerks – 78, Drivers – 36, Typists – 44, Messengers – 52, Others – 30. Represent the above information by a pie chart.
(b) The table below shows the frequency distribution of marks scored by 30 candidates in an aptitude test.
| Marks | 4 | 5 | 6 | 7 | 8 | 9 |
| No of candidates | 5 | 8 | 5 | 6 | 4 | 2 |
Find the mean score to the nearest whole number.
Explanation
(a) Sector angle represented by the officers:
Total number of officers = 240
Clerks = \(\frac{78}{240} \times 360° = 117°\)
Drivers = \(\frac{36}{240} \times 360° = 54°\)
Typists = \(\frac{44}{240} \times 360° = 66°\)
Messengers = \(\frac{52}{240} \times 360° = 78°\)
Others = \(\frac{30}{240} \times 360° = 45°\)
(b)
| Marks (x) | 4 | 5 | 6 | 7 | 8 | 9 | Total |
| No of candidates (f) | 5 | 8 | 5 | 6 | 4 | 2 | 30 |
| \(fx\) | 20 | 40 | 30 | 42 | 32 | 18 | 182 |
Mean score = \(\frac{\sum fx}{\sum f}\)
= \(\frac{182}{30}\)
= \(6.067\) marks \(\approxeq\) 6 marks to the nearest whole number.