
The table below shows the weekly profit in naira from a mini-market.
| Weekly profit (N) | 1-10 | 11-20 | 21-30 | 31-40 | 41-50 | 51-60 |
| Freq | 6 | 6 | 12 | 11 | 10 | 5 |
(a) Draw the cumulative frequency curve of the data;
(b) From your graph, estimate the : (i) median ; (ii) 80th percentile
(c) What is the modal weekly profit?
Explanation
(a)
|
Class Interval (x) |
Frequency (f) |
Cum. Freq |
| 1 - 10 | 6 | 6 |
| 11 - 20 | 6 | 12 |
| 21 - 30 | 12 | 24 |
| 31 - 40 | 11 | 35 |
| 41 - 50 | 10 | 45 |
| 51 - 60 | 5 | 50 |
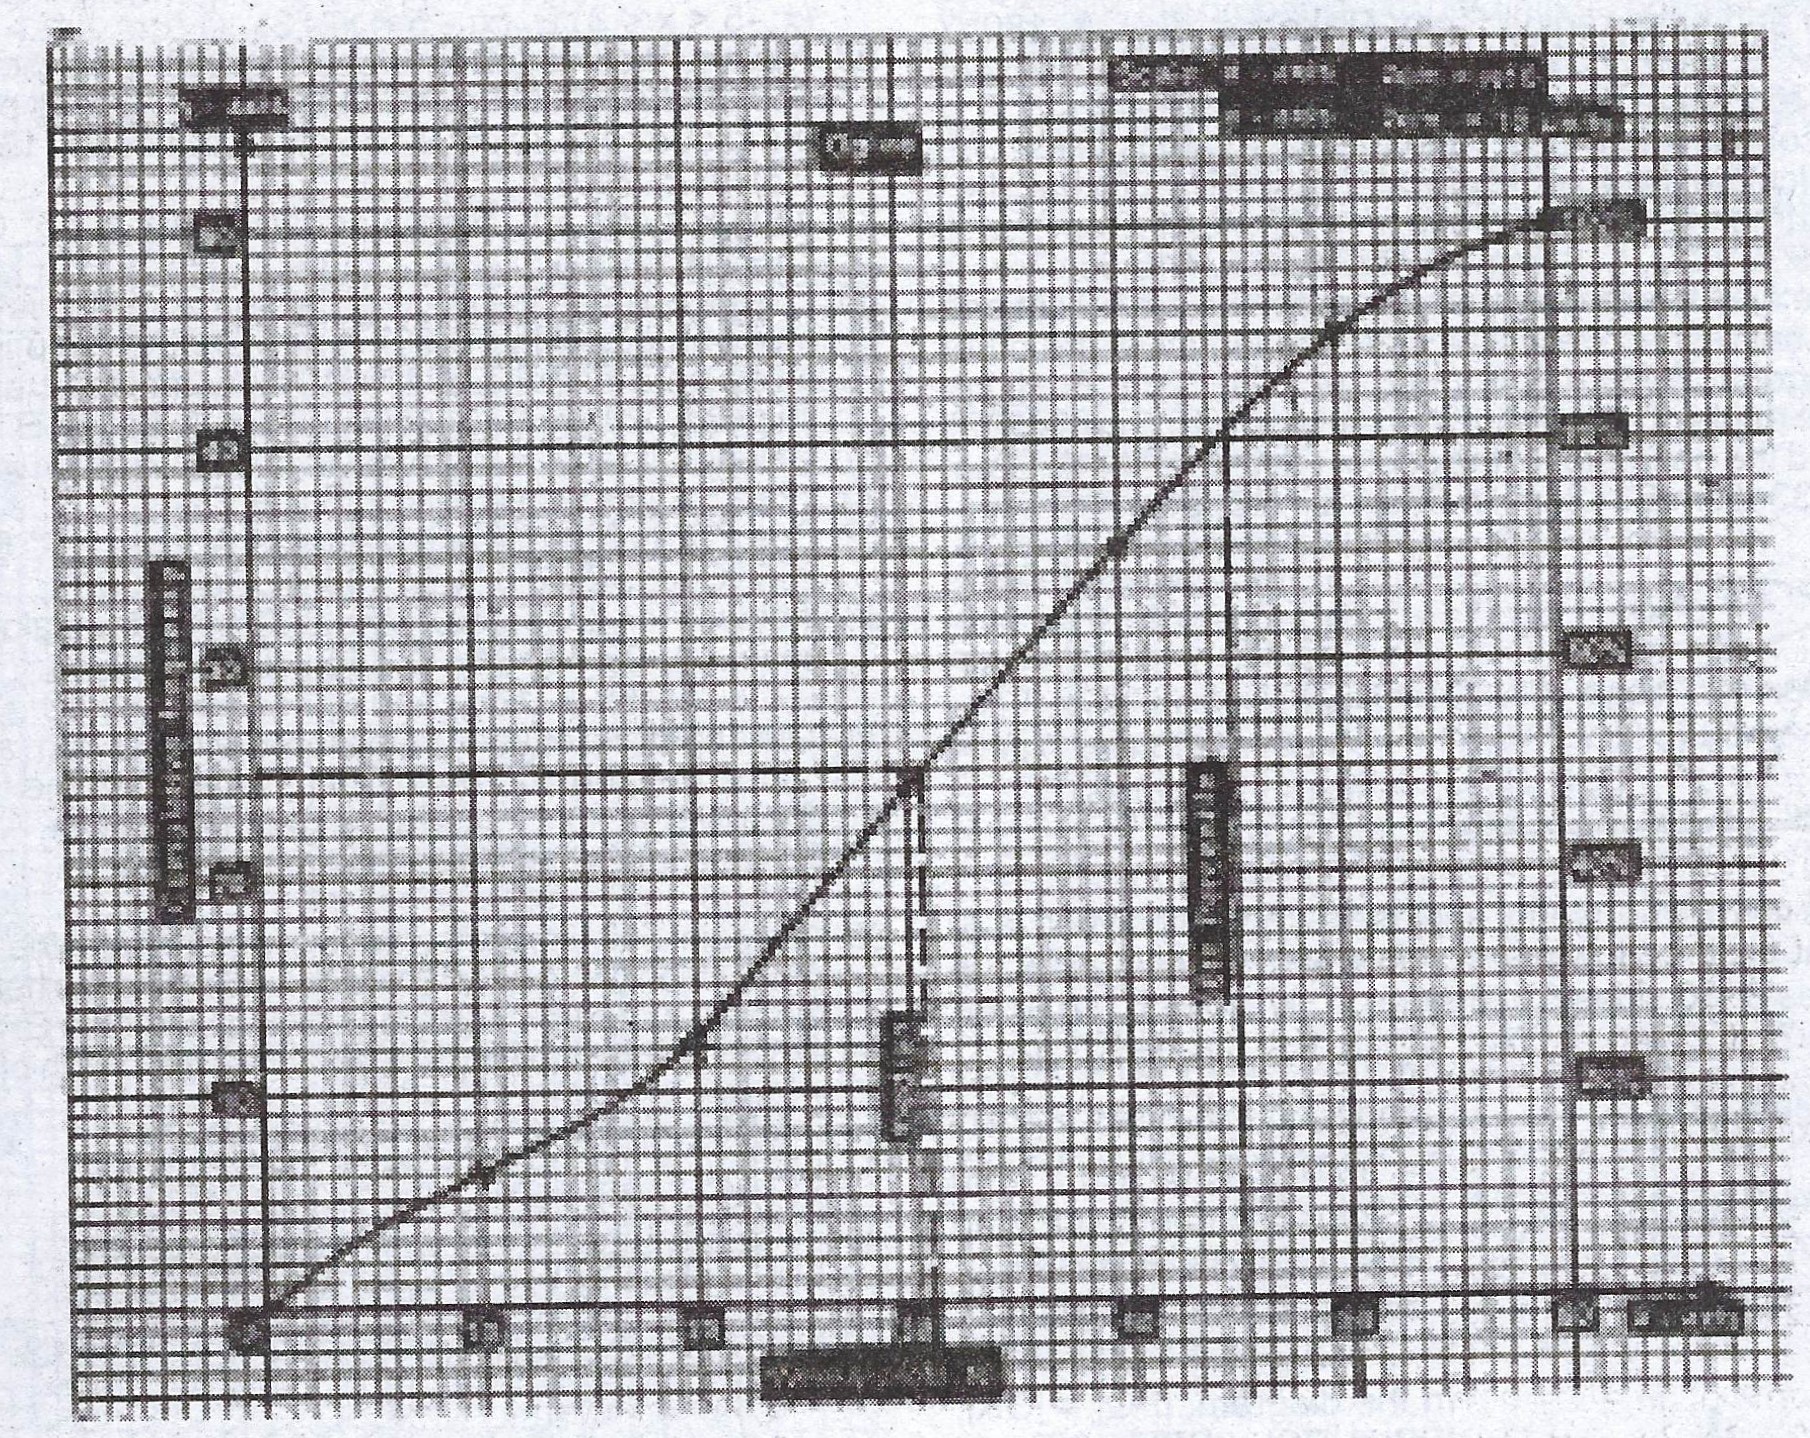
(b)(i) Median = N30.50
(ii) 80th percentile = N45
(c) The modal weekly profit = Lower class boundary of modal class + \(\frac{(f - f_{1}) \times c}{(f - f_{1}) + (f - f_{2})}\)
where \(f_{1}\) = frequency above the modal class ; \(f_{2}\) = frequency below modal class; c = class width; f = frequency of modal class.
\(\therefore \text{Modal profit} = 20.5 + \frac{(12 - 6) \times 10}{(12 - 6) + (12 - 11)}\)
= \(20.5 + \frac{60}{7}\)
= \(N29.07\)