
The table below gives the ages, to the nearest 5 years of 50 people.
| Age in years | 10 | 15 | 20 | 25 | 30 |
| No of people | 8 | 19 | 10 | 7 | 6 |
(a) Construct a cumulative frequency table for the distribution.
(b) Draw a cumulative frequency curve (Ogive)
(c) From your Ogive, find the : (i) median age ; (ii) number of people who are at most 15 years of age ; (iii) number of people who are between 20 and 25 years of age.
Explanation
(a)
| Age in years | No of people | Cum Freq |
| 10 | 8 | 8 |
| 15 | 19 | 27 |
| 20 | 10 | 37 |
| 25 | 7 | 44 |
| 30 | 6 | 50 |
(b) 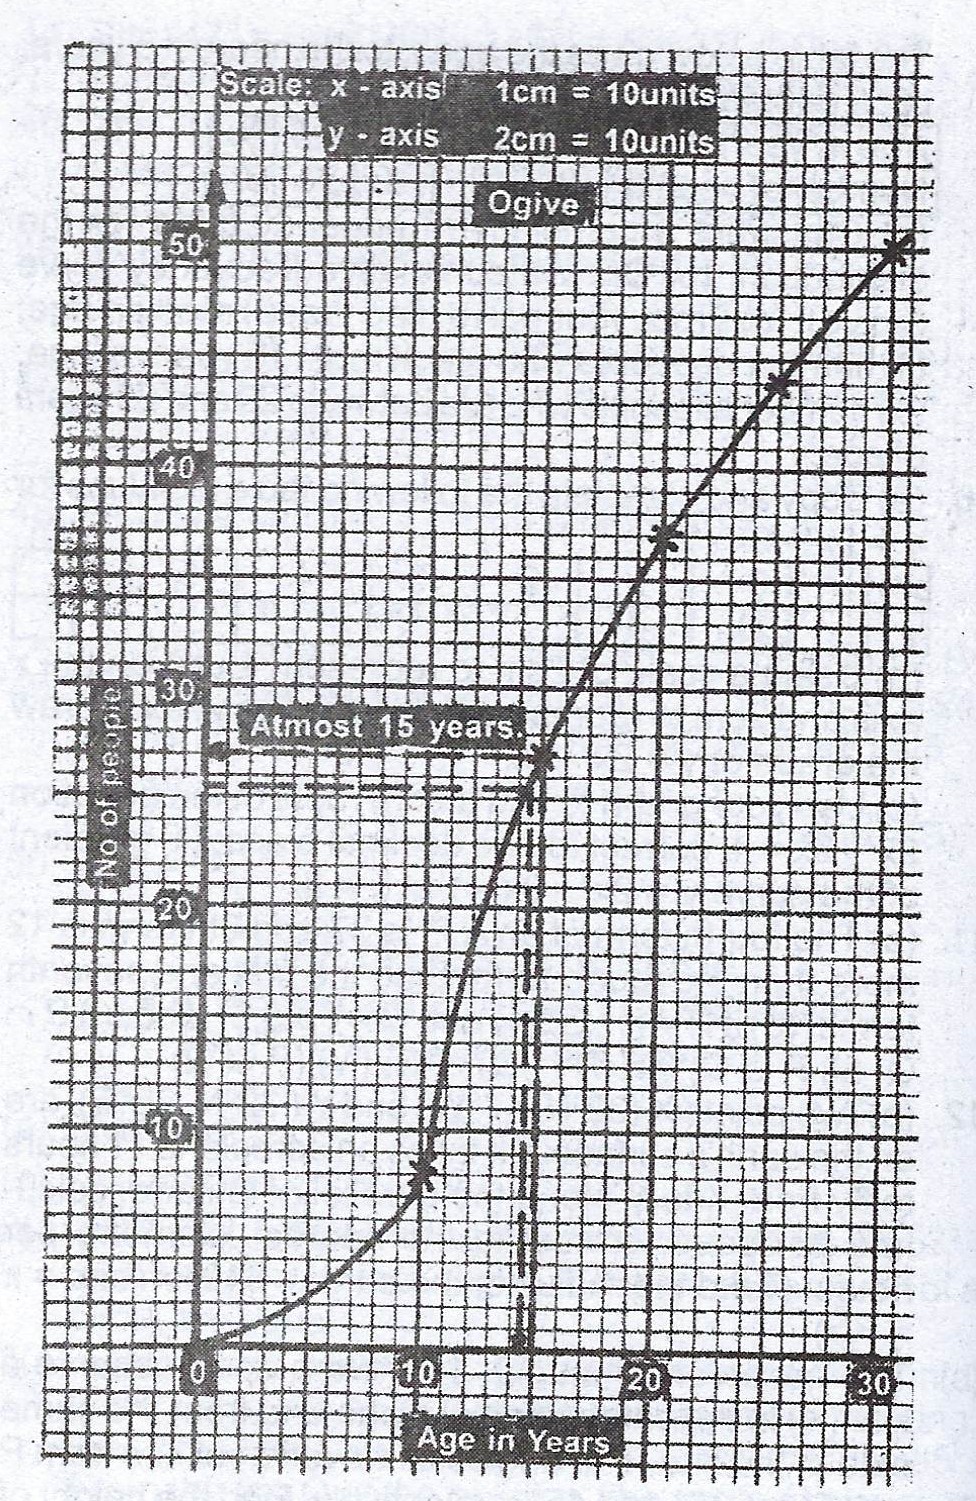
(c)(i) Median age = 14.5 years
(ii) Number of people who are at most 15 years of age = 27 people
(iii) Number of people who are between 20 and 25 years = people who are 25 years - people who are 20 years
= 44 - 37 = 7 people