
The table shows the scores of 2000 candidates in an entrance examination into a private secondary school.
| % Mark | 11-20 | 21-30 | 31-40 | 41-50 | 51-60 | 61-70 | 71-80 | 81-90 |
|
No of pupils |
68 | 184 | 294 | 402 | 480 | 310 | 164 | 98 |
(a) Prepare a cumulative frequency table and draw the cumulative frequency curve for the distribution.
(b) Use your curve to estimate the : (i) cut off mark, if 300 candidates are to be offered admission ; (ii) probability that a candidate picked at random, scored at least 45%.
Explanation
(a)(i)
| Marks (x) | No of pupils (f) | Cum Freq |
| 11 - 20 | 68 | 68 |
| 21 - 30 | 184 | 252 |
| 31 - 40 | 294 | 546 |
| 41 - 50 | 402 | 948 |
| 51 - 60 | 480 | 1428 |
| 61 - 70 | 310 | 1738 |
| 71 - 80 | 164 | 1902 |
| 81 - 90 | 98 | 2000 |
(ii) 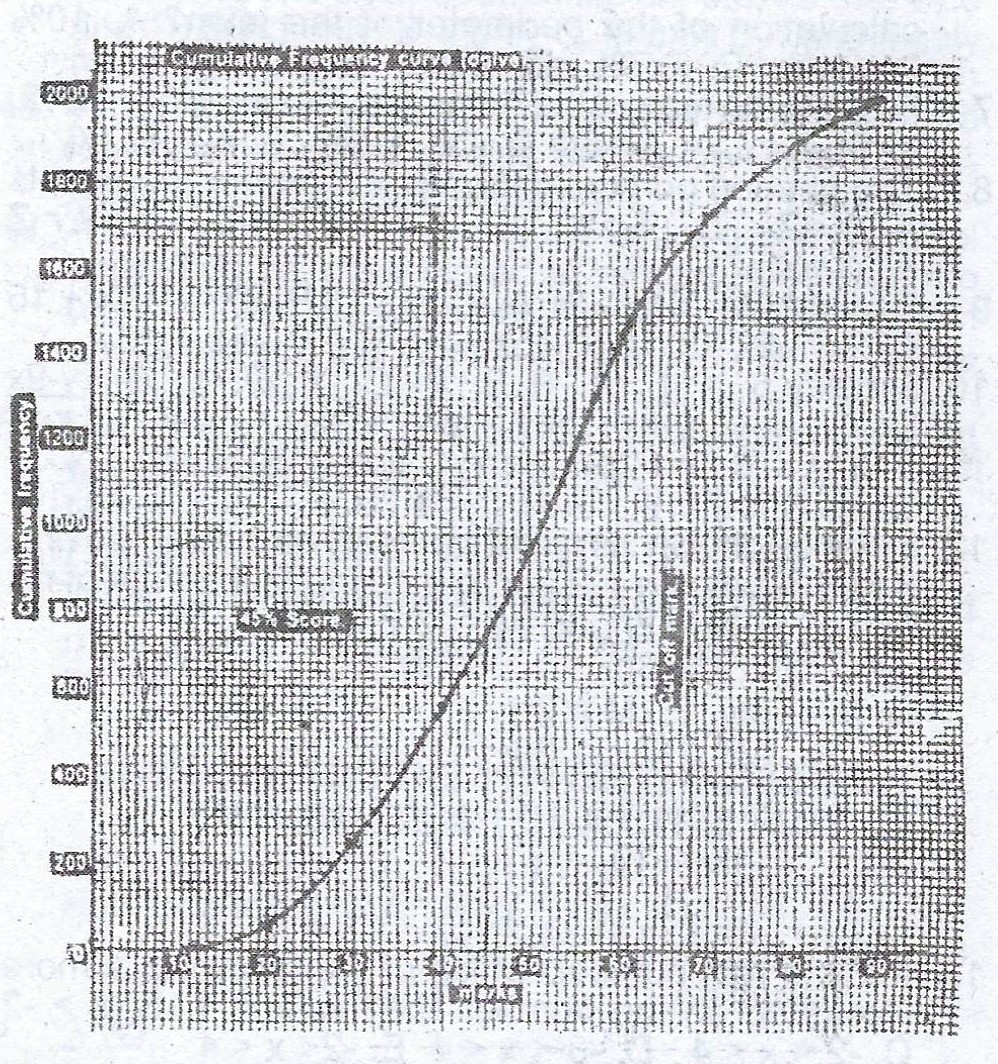
(b)(i) Cut off mark = 68 marks for reading at 1700.
(ii) Candidates scoring more than 45% = 2000 - 720 = 1280
\(\therefore\) P(scoring at least 45%) = \(\frac{1280}{2000} = 0.64\)