
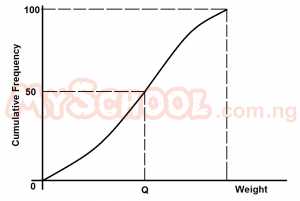
The graph is the cumulative frequency curve for the weight distribution of 100 workers in a factory. Which of the points P,Q,R,S and T indicates the median weight?
- T
- S
- R
-
Q

- P