
The table below shows how a company’s sales manager spent his 1995 annual salary.
| Food | 30% |
| Rent | 18% |
| Car Maintenance | 25% |
| Savings | 12% |
| Taxes | 5% |
| Others | 10% |
(a) Represent this information on a pie chart.
(b) Find his savings at the end of the year if his annual salary was N60,000.00.
Explanation
Angle of sector:
\(Food = \frac{30}{100} \times 360° = 108°\)
\(Rent = \frac{18}{100} \times 360° = 64.8°\)
\(\text{Car Maintenance} = \frac{25}{100} \times 360° = 90°\)
\(Savings = \frac{12}{100} \times 360° = 43.2°\)
\(Taxes = \frac{5}{100} \times 360° = 18°\)
\(Others = \frac{10}{100} \times 360° = 36°\)
(a) 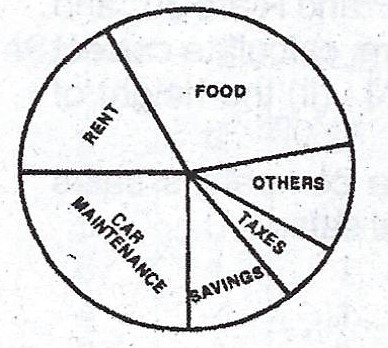
(b) Annual Salary = N60,000.00
\(\therefore Savings = N(\frac{12}{100} \times 60,000) = N7,200\)