
The table below shows the number of eggs laid by the chickens in a man’s farm in a year.
| No of eggs per year | No of chickens |
| 45 – 49 | 10 |
| 50 – 54 | 36 |
| 55 – 59 | 64 |
| 60 – 64 | 52 |
| 65 – 69 | 28 |
| 70 – 74 | 10 |
(a) Draw a cumulative frequency curve for the distribution.
(b) Use your graph to find the interquartile range.
(c) If a woman buys a chicken from the farm, what is the probability that the chicken lays at least 60 eggs in a year?
Explanation
(a)
|
No of eggs per year |
Class boundaries | Freq | Cum Freq |
| 45 - 49 | 44.5 - 49.5 | 10 | 10 |
| 50 - 54 | 49.5 - 54.5 | 36 | 46 |
| 55 - 59 | 54.5 - 59.5 | 64 | 110 |
| 60 - 64 | 59.5 - 64.5 | 52 | 162 |
| 65 - 69 | 64.5 - 69.5 | 28 | 190 |
| 70 - 74 | 69.5 - 74.5 | 10 | 200 |
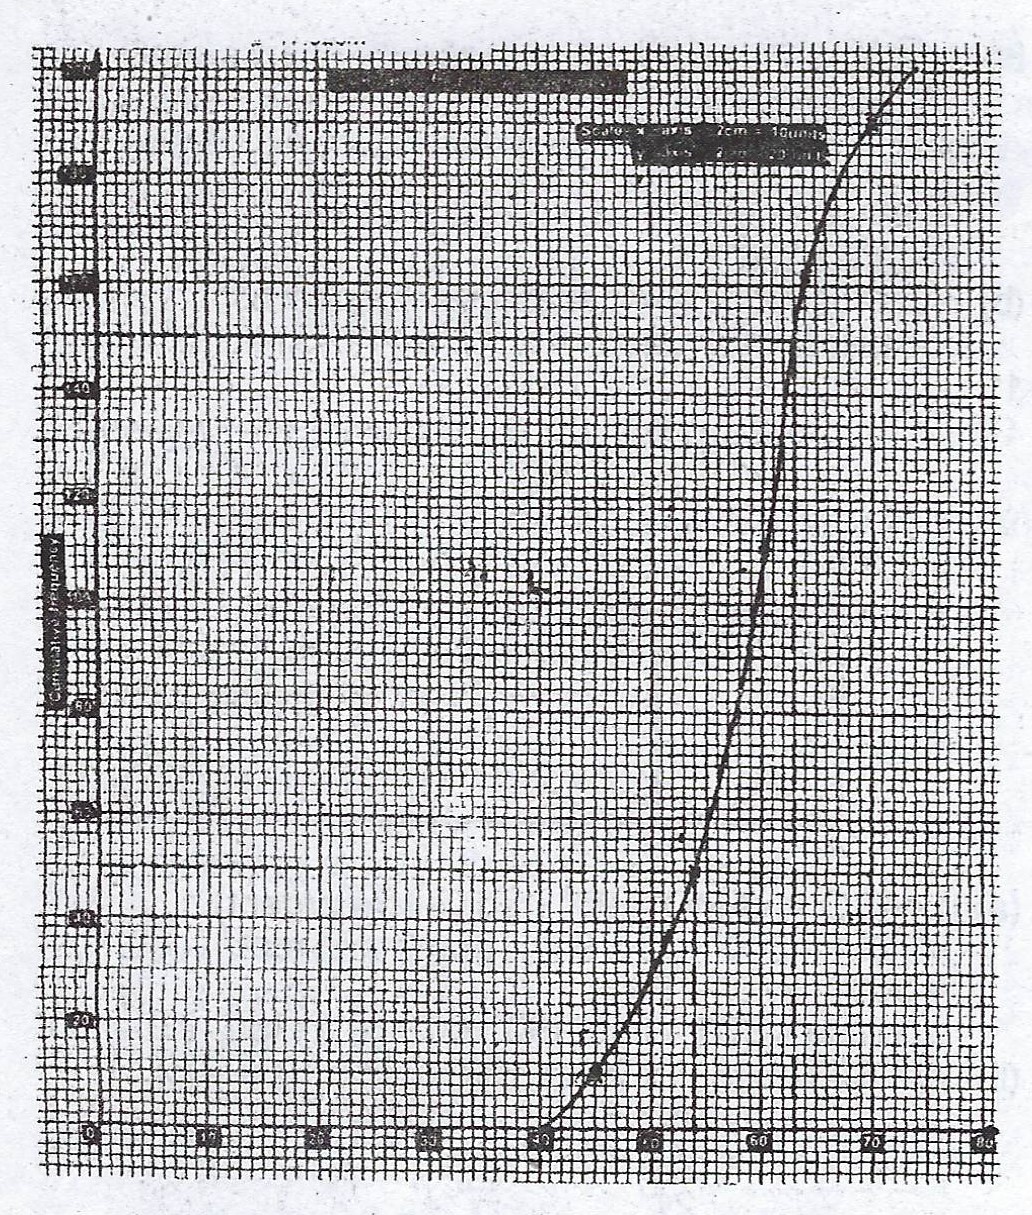
(b) From the graph, the interquartile range = \(Q_{3} - Q_{1} = 63 - 54 = 9\)
(c) Probability of a chicken laying at least 60 eggs in a year = \(\frac{52 + 28 + 10}{200}\)
= \(\frac{90}{200} = \frac{9}{20}\)