
(a) Draw the table of values for the relation \(y = x^{2}\) for the interval \(-3 \leq x \leq 4\).
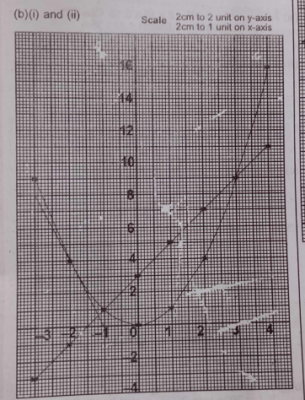
(b) Using a scale of 2 cm to 1 unit on the x- axis and 2 cm to 2 units on the y- axis, draw the graphs of : (i) \(y = x^{2}\) ; (ii) \(y = 2x + 3\) for \(-3 \leq x \leq 4\).
(c) Use your graph to find : (i) the roots of the equation \(x^{2} = 2x + 3\) ; (ii) the gradient of \(y = x^{2}\) at x = -2.
Explanation
(a)
| x | -3 | -2 | -1 | 0 | 1 | 2 | 3 | 4 |
| \(y = x^{2}\) | 9 | 4 | 1 | 0 | 1 | 4 | 9 | 16 |
(b) \(y = 2x + 3\)
| x | -3 | -2 | -1 | 0 | 1 | 2 | 3 | 4 |
| 2x | -6 | -4 | -2 | 0 | 2 | 4 | 6 | 8 |
| 3 | 3 | 3 | 3 | 3 | 3 | 3 | 3 | 3 |
| y | -3 | -1 | 1 | 3 | 5 | 7 | 9 | 11 |
see graph above
(c)(i) The roots of the equation are -1 and 3, from the graph.
(ii) The gradient of \(y = x^{2}\) at x = -2 : \(\frac{8}{-2.5} = -3.2\)