
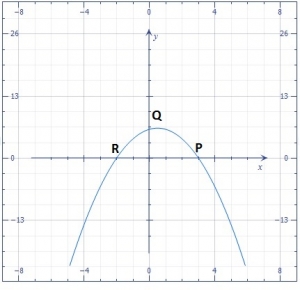
The diagram is the graph of \(y = 6 + x – x^2\). The graph intercepts the x- axis at P and R and the y- axis at Q.
What is the value of y at Q?
-
\(6\frac{1}{3}\)

- 6
- 3
- zero