
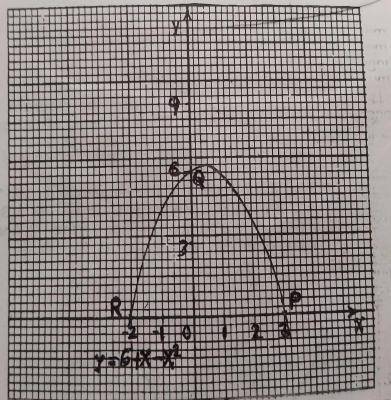
The diagram is the graph of \(y = 6 + x – x^2\). The graph intercepts the x-axis at P and R and the y-axis at Q.
When \(y = 3\frac{1}{3}\), what is the positive value of x?
- \( 2\frac{1}{2}\)
-
\( 2\frac{1}{5}\)

- \( 1\frac{1}{5}\)
- zero
The correct answer is: B
Explanation
Draw a straight horizontal line across the y-axis at y = 3\(\frac{1}{3}\). let the line cut through the curve.
the points where the horizontal line meets the curve, trace it down to the x-axis to obtain the values of x when y = 3\(\frac{1}{3}\)
take only the positive value of x.