The marks obtained by 40 students in an examination are as follows :
85 77 87 74 77 78 79 89 95 90 78 73 86 83 91 74 84 81 83 75 77 70 81 69 75 63 76 87 61 78 69 96 65 80 84 80 77 74 88 72.
(a) Copy and complete the table for the distribution using the above data.
| Class Boundaries | Tally | Frequency |
| 59.5 – 64.5 | ||
| 64.5 – 69.5 | ||
| 69.5 – 74.5 | ||
| 74.5 – 79.5 | ||
| 79.5 – 84.5 | ||
| 84.5 – 89.5 | ||
| 89.5 – 94.5 | ||
| 94.5 – 99.5 |
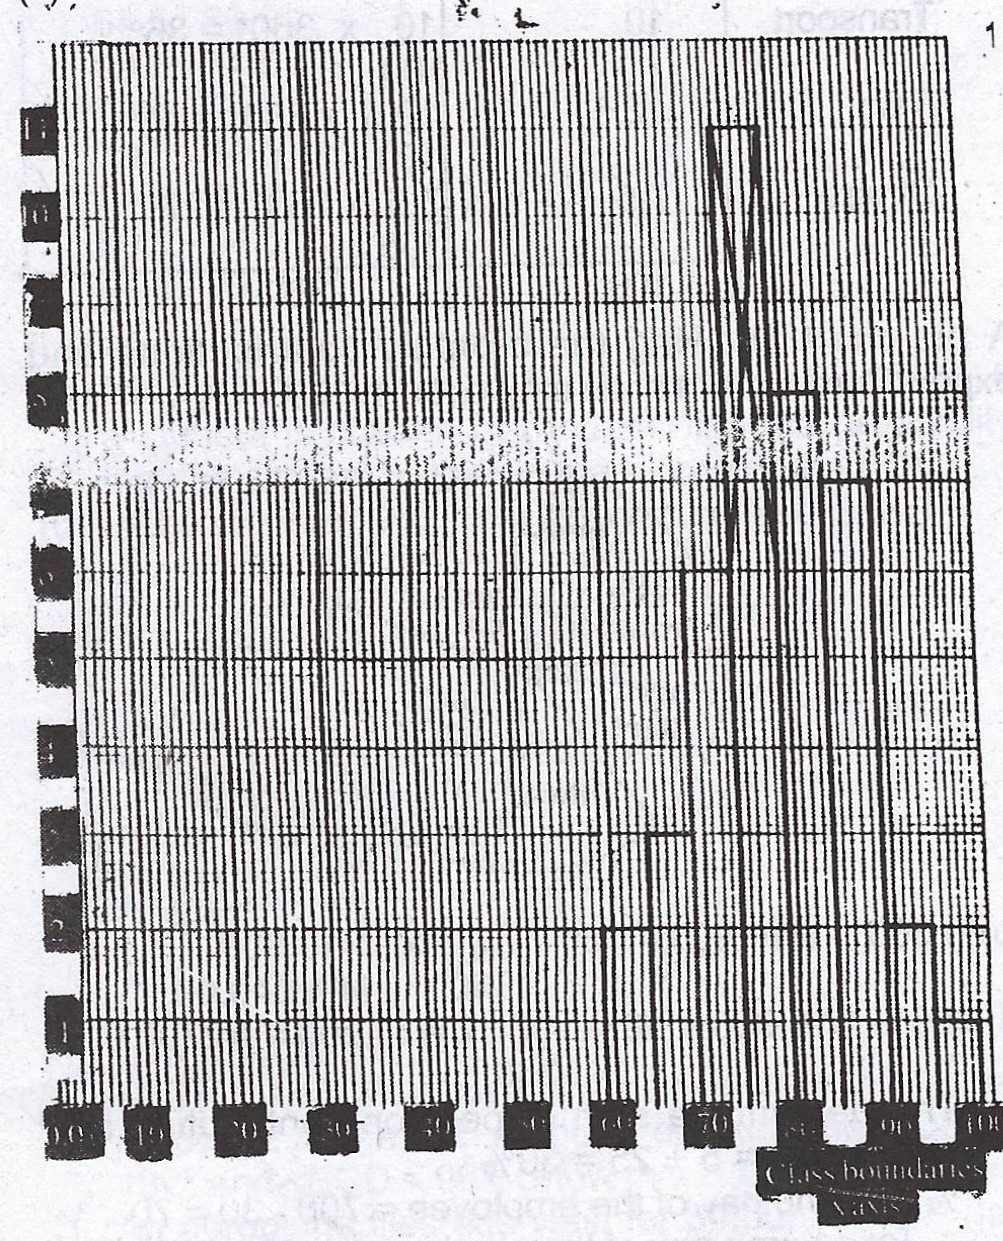
(b) Draw a histogram to represent the distribution.
(c) Using your histogram, estimate the modal mark.
(d) If a student is chosen at random, find the probability that the student obtains a mark greater than 79.
Explanation
(a)
| Class Boundaries | Tally | Frequency |
| 59.5 - 64.5 | || | 2 |
| 64.5 - 69.5 | ||| | 3 |
| 69.5 - 74.5 | 6 | |
| 74.5 - 79.5 | 11 | |
| 79.5 - 84.5 | 8 | |
| 84.5 - 89.5 | 7 | |
| 89.5 - 94.5 | || | 2 |
| 94.5 - 99.5 | | | 1 |
(b) 
An histogram to represent the distribution of 40 students in an examination.
(c) Modal mark : \(\frac{74.5 + 79.5}{2} = \frac{154}{2} = 77\)
(d) Number of students who obtained marks greater than 79 : 8 + 7 + 2 + 1 = 18.
Total number of students = 40
\(\therefore\) P(mark greater than 79) = \(\frac{18}{40} = \frac{9}{20}\)

