
The table shows the age distributions of the members of a club.
| Age (years) | 10-14 | 15-19 | 20-24 | 25-29 | 30-34 | 35-39 |
| Frequency | 7 | 18 | 25 | 17 | 9 | 4 |
(a) Calculate, correct to one decimal place, the mean age.
(b) (i) Draw a histogram to illustrate the information.
(ii) Use the histogram to estimate the modal age .
(c) If a member is selected at random, what is the probability that he/she is in the modal class?
Explanation
(a)
| Class Interval | Freq (f) | Classmark (x) | \(fx\) |
| 10 - 14 | 7 | 12 | 84 |
| 15 - 19 | 18 | 17 | 306 |
| 20 - 24 | 25 | 22 | 550 |
| 25 - 29 | 17 | 27 | 459 |
| 30 - 34 | 9 | 32 | 288 |
| 35 - 39 | 4 | 37 | 148 |
| 80 | 1835 |
\(\bar{x} = \frac{\sum fx}{\sum f}\)
= \(\frac{1835}{80}\)
\(\approxeq 22.9yrs\)
(b)(i)
| Class Interval | Freq (f) | Class boundaries |
| 10 - 14 | 7 | 9.5 - 14.5 |
| 15 - 19 | 18 | 14.5 - 19.5 |
| 20 - 24 | 25 | 19.5 - 24.5 |
| 25 - 29 | 17 | 24.5 - 29.5 |
| 30 - 34 | 9 | 29.5 - 34.5 |
| 35 - 39 | 4 | 34.5 - 39.5 |
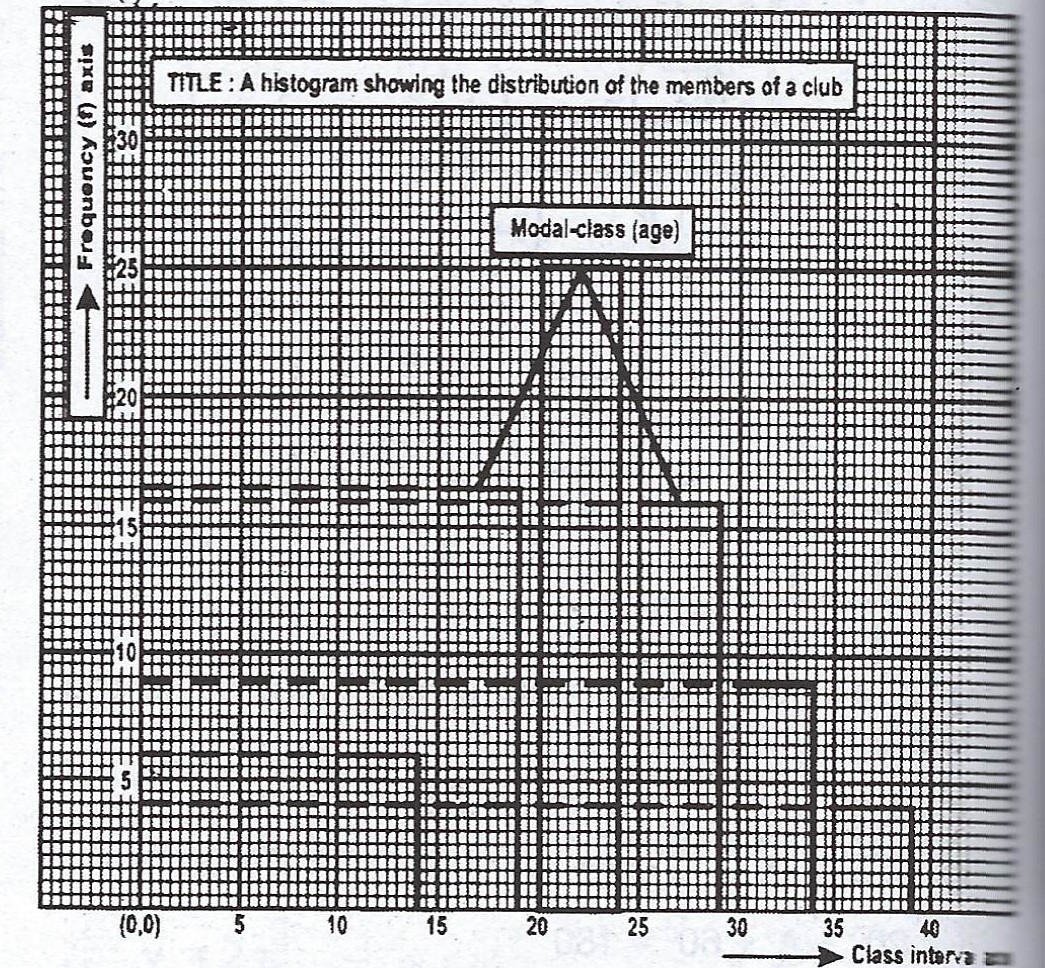
(ii) Modal age = \(\frac{20 + 24}{2} = 22\)
(c) P(picking from the modal class) = \(\frac{25}{80}\)
= \(\frac{5}{16}\).