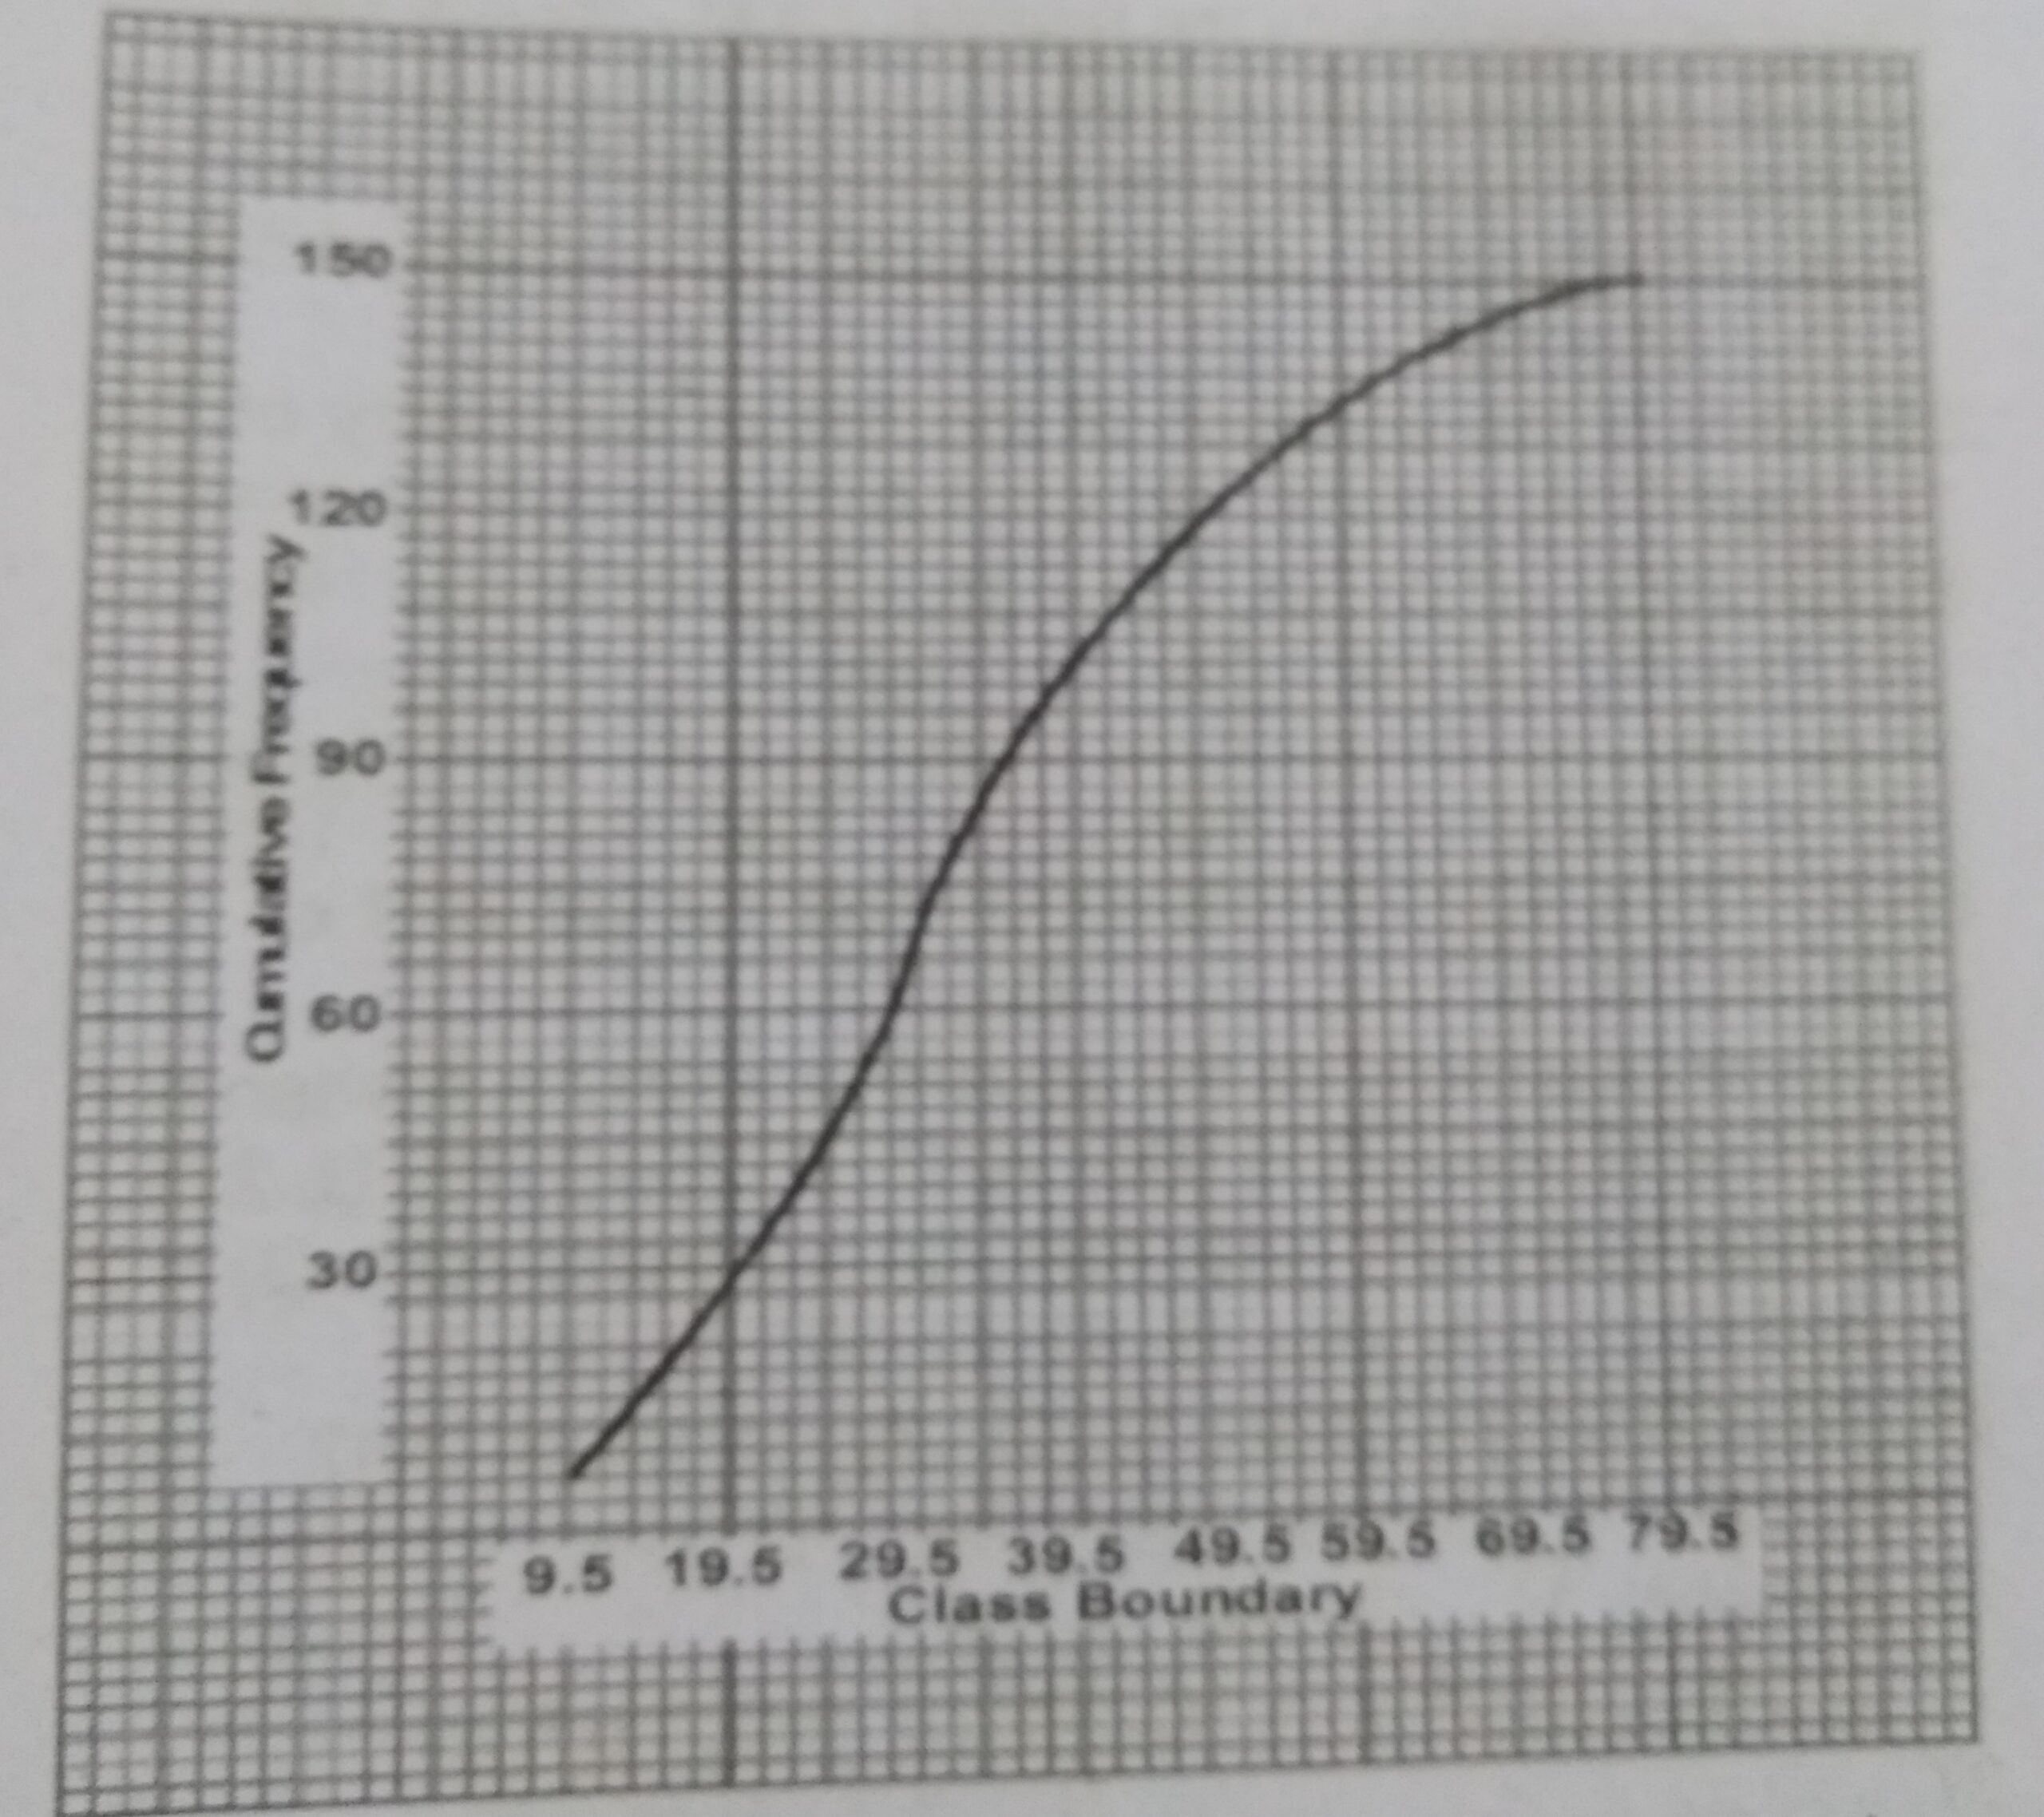
Using the cumulative frequency curve, estimate the median of the data represented on the graph.
35.5
36.5
37.5
38.5
The correct answer is: B
Explanation
No official explanation is available for this question at this time. Please check contributions posted by others below. If you can provide an explanation to help other student learn.