
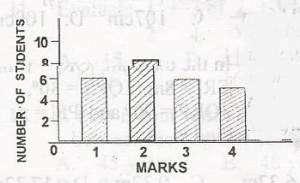
The bar chart shows the frequency distribution of marks scored by students in a class test. What is the median of the distribution?
-
2

- 4
- 6
- 8
The correct answer is: A
Explanation
median = (\(\frac{N + 1}{2}\))th = (\(\frac{25 + 1}{2}\))th= \(\frac{26th}{2}\)
= 13th
the 13th is 2