MyStudyPals.com MyStudyPals.com
  • Login
  • Feed

Resources

  • πŸ“°
    Latest School News
  • πŸ“š
    Scholarships
  • πŸŽ“
    JAMB Syllabus
  • πŸ“
    Jamb Brochure

Information

  • πŸ”—
    Contact US
  • πŸ”—
    Privacy Policy
  • πŸ”—
    Terms and Conditions
  • πŸ”—
    About US

The graph of y = \(ax^2 + bx + c\) is shown oon the diagram….

  • πŸ“‘ Past Questions
  • βŒ› Take CBT exam
  • πŸ“Ÿ Referral
  • 🎫 Support
  • πŸ“’ Earnings
Mathematics WAEC 2017

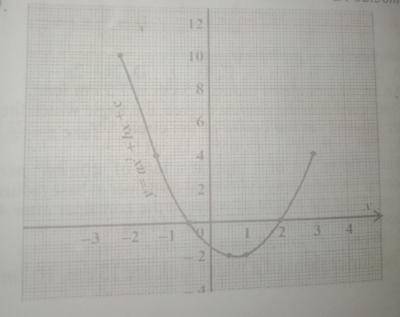
The graph of y = \(ax^2 + bx + c\) is shown oon the diagram. Find the minimum value of y

  • -2.0
  • -2.1 checkmark
  • -2.3
  • -2.5

The correct answer is: B

Explanation

Find the minimum value of y is the point where the base of the curve corresponds to the value of y i.e. at -2.1

Previous Question Next Question

Leave A Comment

© 2025 MyStudyPals.com